Annals of Systems Biology
The investigation of dominated anaerobic bacteria throughout degradation of a raw antibiotic Industry wastewater
Delia T Sponza* and Nefise Erdincmer
Cite this as
Sponza DT, Erdincmer N (2020) The investıgatıon of dominated anaerobic bacteria throughout degradation of a raw antibiotic Industry wastewater. Ann Syst Biol 3(1): 015-022. DOI: 10.17352/asb.000006Introduction
In recent years, it was found that the COD and antibiotics in the antibiotic industry wastewaters can not be effectively removed with conventional biological treatment processes [1]. The experiences performed with advanced treatment processes (Hydrogen peroxide and fentone) showed low antibiotic yields and high cost [2-5] showed that tetracyline antibiotic concentrations between 0-50 mg/l decrease the methane gas productions. Gartiser, et al., [6] observed that the macrolide group of antibiotics caused toxicity to methanogens under anaerobic conditions. The Oxytetracyline (OTC) was derived from Streptomyces aureofaciens and is the commmonly used tetracyclines in animal production [5]. Tylosin (TL) is a microbial-synthesized macrolide antibiotic that is active against most gram-positive bacteria and is typically administered in animal feed. Archaea, such as acetate-utilizing Methanosaeta sp., are considered the largest population in anaerobic swine digesters [7] and would not be expected to be sensitive to tylosin. The dominated anaerobic bacteria number and the identification of the bacteria were not performed extensively throughout anaerobic biodegradation of OTC and TL antibiotics [8]. Aceticlastic methanogen population abundance for Chlortetracycline (CTC) treatments (Methanosaetaceae and Methanosarcinaceae sp.) were less than observed for the no-antimicrobial control treatments. Methane and carbon dioxide generation rates were inhibited due to the presence of CTC [8]. For TL, a significant shift in the relative abundance of aceticlastic methanogens Methanosaetaceae and Methanosarcinacea spp. was observed [8]. While methane and carbon dioxide generation rates were unchanged due to TL, the increase in Methanosarcinaceae spp. suggests affinity for acetate, other VFAs were effectively utilized during methanogenesis [8].
In the framework of this study the antibiotics and COD removals were investigated with the biofilm formation of the around of sponge support materials in anaerobic batch reactors at decrasing HRTs from 10 to 0.2 days. The dominated methane bacteria (Methanosarcina sp., Methanosphera sp., Methanococcus sp., Methanobacterium sp., Methanospirillum sp., Methanogenium sp., Methanothrix sp., Methanobrevibacter sp., Methanolobus sp.) and the dominated acidogenic and acedogenic bacteria numbers were enumerated. The statistical analysis between bacterial numbers, antibiotic yields and COD removal efficiencies, methane production and specific methanogenic activity were evaluated.
Material and method
Experiments were performed for a period of 45 days at a temperature of 37oC at batch anaerobic reactors with an active volume of 100 ml. The reactors were continuously stirred at six different HRTs. The HRTs were adjusted by the batch flow rates. The raw antibiotic industry wastewater was taken from the wastewater of an antibiotic industry producing tylosin and oxytetracycline antibiotics. Table 1 showed the operating parameters while Table 2 exhibited the characterization of raw antibiotic industry wastewater. The reactors were fed with a peristaltic pump with a flow rates given in Table 1 in batch mode. A volume equal to the feding was with drawn from the reactors every day. 500 mg/l NaHCO3 and 66mg/l sodium thioglycollate were added to the raw wastewater in order the dominate the methane bacteria during methanogeness for maintaining the pH between 7 and 8,5. Furthermore, in order to stimulate the anaerobic growth of methane-Archaea bacteria Vanderbilt mineral medium was added to the raw wastewater in dilutes samples [1,9]. The acidogenic and acedogenic bacteria numbers were isolated according to the Bergey’s Manual [1] in diluted samples each reactor was operated 45 days. The results given in figures versus HRTs indicate the data collected on days 45, at the end of operation period of the reactors. Ten sponges with a diameter and volume of 1 cm and 1 cm3, respectively, were added to the reactor to provide enough surface for biomass growth and immobilization of suspended biomass. The biomass thickness in the sponges was automatically measured in an Olympus Research Microscope 7800 as cm by a validated measurement programme loaded to the computer with a computer curser. The anaerobic seed was taken from an anaerobic methanogenic reactor of Pakmaya Yeast Factory in İzmit, Turkey.
Analytical procedure
The antibiotics were measured in an Agilent GC-MS. Bacterial numbers enumerated following the Bergey’s Manual [1]. The identification of the acidogenic, acedogenic and methane-Arcaea were performed according the procedure given in Sponza and Cıgal [10]. The COD, TSS, VSS, TN, TP, pH, redox potential were measured following the Standard Methods [11]. The COD was determined with closed reflux method (Standard Methods 5220) in 2 ml acidified samples and the absorbance was measure by using a Spectroquant Spectrophotometer at 610 nm wave lentgh. The TSS was measured at 105 ˚C for 1 h in an incubator by adding the sluge samples to the porcelain cups (Standard Methods 2540 A). The VSS in the sludge samples was measured by passing of the samples from Millipore Membrane Filter with a pore size of 0,45 µm and the supernatant was incubated at an owen at 600 ˚C during 2 hours. The differences between weigths give the VSS level of the sludges (Standard Methods 2540 B). TN was measured by digestion of samples with 50 ml digestion reagent (6.7 mL H2SO4, 6.7 g K2SO4, and 0.365 g CuSO4) to distillation flask. Then the solution was mixed, heated and boiled until the volume is greatly reduced to about 25 mL. The absorbances measured in an Aquamate sprectrophotometer etat at 610 nm. The TN valus were correlated by the calibration curves (Standard Methods, 4500 B). Spesific Methanogenic Activity (SMA), HCO3 alkalinity and Total Volatile Fatty Acid (TVFA) were measured according to Speece [9]. Spesific methanogenic activity, Methane and total gases was measured in an Agilent GC-MS. The specific sludge activity or SMA is determined by methane production rate. The methane gas accumulated in test vials (batches) during incubations of biomass in Vanderbilt mineral medium supplemented with different substrates at saturating concentrations. The glass vessels were 56-ml serum vials closed with butyl rubber stoppers and aluminium crimps. Standard stock solutions of tylosin tartrate and OTC (2-100 mg/ml) were prepared by dissolving 11.6 mg of tylosin tartrate in methanol and then diluted to 100 mL. The working standard solutions of the respective drugs were prepared by serial dilution using distilled water.
The quantitation of the drugs has been achieved by a matrix-matched calibration method [12]. Recoveries have been found to be > 70%. Method performance associated with method detection limits (MDLs), Limit of Detection (LOD) and limit of quantitation (LOQ) of the compounds were compared and illustrated in gradient elution of water and methanol solvents consisting of 0.1% (v/v) formic acid in water and 100% methanol are passed through a C18 analytical column at a flow rate 350 μL/min to achieve the separation of the complex mixture of hospital wastewater. An auto-sampler is used to inject 10 μL sample solution. ANOVA test statistics to determine the correlations and the sensitivities between parameters were calculated with Microsoft EXCELL version 2008. F values indicates the correlation between x and y variables. Furthermore, Pearson r correlation is used to correlate and to measure the degree of the linear relationship between related variables. The following formula is used to calculate the Pearson r correlation:
Here,
rxy= Pearson r correlation coefficient between x and y
n number of observations
xi = value of x (for ith observation)
yi = value of y (for ith observation)
Results and discussıon
Effect of the HRT on the process stability
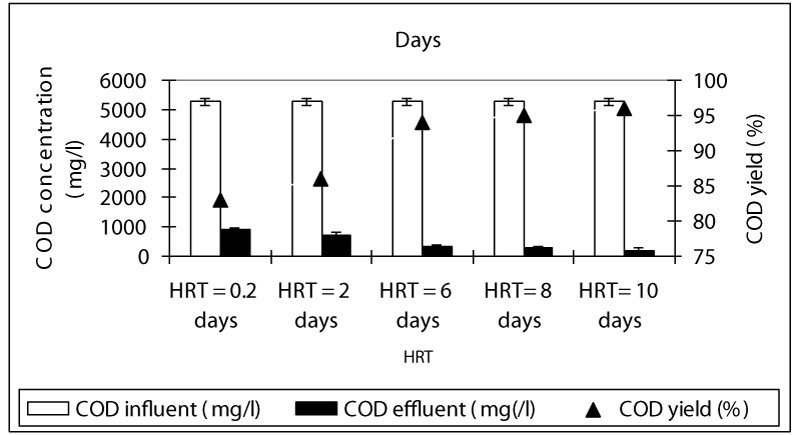
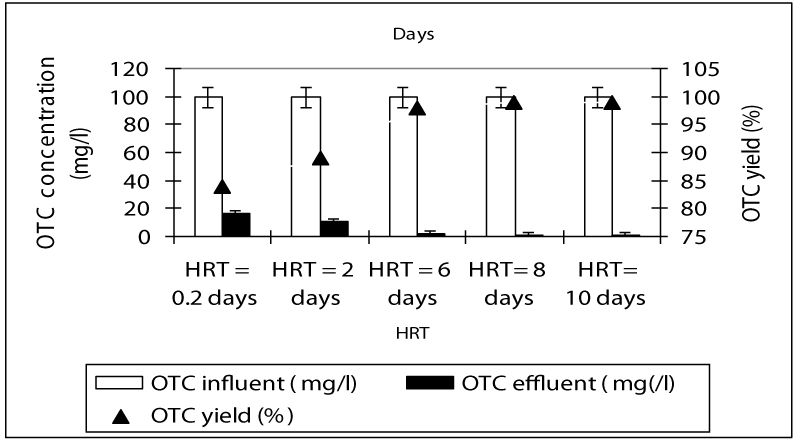
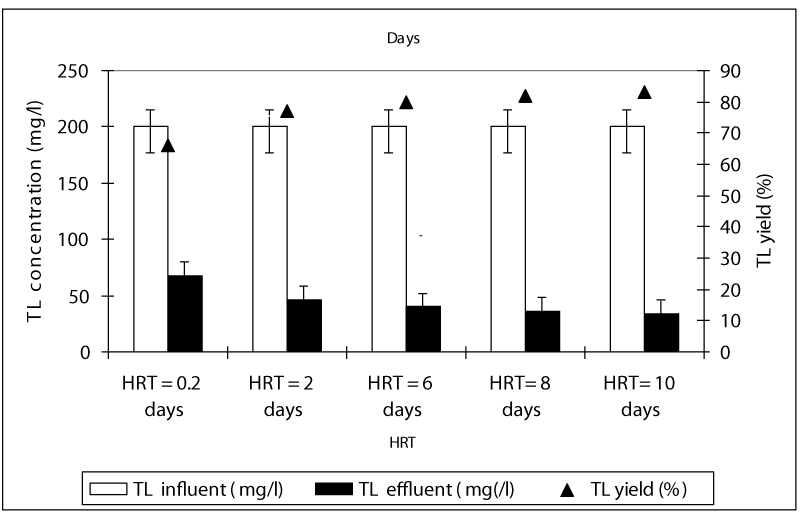
Figure 1 shows a summary of the experimental results obtained at different values of HRT in the anaerobic batch reactors studied. The COD yields at HRTS 0.2 and 2 days were around 83 and 86% while the COD yields were 94, 95 and 96% at HRTs 6, 8 and 10 days. As can be seen, although an increase in the HRT exhibited an improvement in the effluent quality, this increase of COD yields was not found to be significant (ANOVA, R2= 0.66 F= 2.56, p>0,0001,Perason r=0,56). Hence, the process performance appears to be not directly related to the HRT. Although an increase in the HRT would result in a decrease in the wastewater flow rate through the batch feding and continouos stirring and improving the mass transfer from the liquid to the support material (sponge), this, was not favoring the process performance, significantly. Therefore, for the maximum COD yield the optimum HRT was found to be 6 days in order to reduce the time spending for the treatment and minimize the volume used. The OTC removal efficiencies were 84 and 89% at HRTs 0.2 and 2 days while the antibiotic yields at high HRTs (6, 8 and 10 days HRT) were detected as 98, 99, and 99% (Figure 2). Similarly, it was found that although the antibiotic yields increased versus increasing HRTs, this increase was not found to be significant (ANOVA, R2= 0.60 F= 2.339, p>0,0001,Perason r=0,59). Therefore, the optimum HRT for maximum OTC yield was found to be 6 days. The removal efficiencies for TL antibiotic were low compared to OTC. The yields for TL were 67, 77, 80, 82 and 83% at HRTs 0,2, 2, 6, 8 and 10 days, respectively (Figure 3). The optimum HRT for maximum tylosin yield was found to be 6 days. A linear significant correlation betweem HRT and TL yields was detected (ANOVA, R2= 0.79 F= 13.65, p=0,0001,Perason r=0,82).
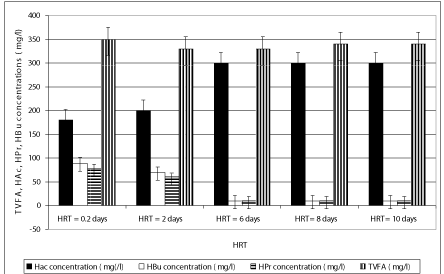
The concentration of TVFA in the effluent at decreasing HRTs was not so higher in comparison with that observed in the HRTs with long detention time (Figure 4). The TVFA concentrations were recorded as 298, 256, 189, 178 and 160 mg/l as the HRTs increased from 0.2 days up to 2, 6, 8 and 10 days (Figure 4). At higher HRTs (8, 10 days), the effluent TVFA concentration slightly decreased, achieving a minimum value at a HRT of 10 days due to the utilization of the volatile organic acids for methane production. Because of the organic matter decomposition in anaerobic conditions, the effluent alkalinity increased sligthly as the HRT increased (Figure 1), given that the buffering capacity of the experimental systems was found to be at favourable levels with excessive alkalinity present at all HRTs. Under these conditions, the stability of the process and efficiency of methanogenesis were not significantly affected . Non-methanogenic microorganisms responsible for hydrolysis and digestion can be adapted to low pH while the methanogenic microorganisms will lose activity at the low pH. During hydrolysis, the particulate materials are converted to soluble compounds and further degraded to acetate, hydrogen, carbon dioxide, propionate and butyrate. Throughout anaerobic treatment of OTC and TL, high methane productions have been associated with an acidogenic pathway that produces a mixture of organic acids, such as acetic acid and butyric acid with high pH valus such as 8.0 and 8.5 (Figures 3, 4 and 7). The Acetic acid (HAc), butyric acid (HBu), propionic acid (HPr) detected in the anaerobic batch reactors versus decreasing HRTs is given in Figure 4. The HAc concentration (ranging from 245 and 321 mg/l) was greater than the HBu concentration (ranging from 10 mg/l to 67 mg/l) and HPr concentration (10-78 mg/l) versus increasing HRTs (Figure 4). The HAc concentrations are lower at HRTs 0.2 and 2 days than that measured at HRTs 6, 8 and 10 days.
The HAc/HBu ratios for all HRTs in anaerobic batch systems exhibit a similar trend; these factors increase with decreasing HRT and reach a maximum at the optimum HRT of 0.2 days. Beyond this optimum, TVFA and the HAc/HBu ratio decreased with decreasing HRT (ANOVA, R2= 0.79, F 13.89, p=0,0001,Perason r=0,87 ). The HAc/HBu ratios were 3.29, 3.89, 4.01, 4.11 and 4.13 at HRTs 0.2, 2, 6 , 8 and 10 days, respectively(data not shown). This ratio can therefore be used to indicate the optimum HRT for maximum antibiotic removals and methane gas productions because the methane yields obtained in HRTs 6, 8 and 10 days were slightly higher than that the lower HRTs (0.2 and 2 days). The methane yields were 0.11, 0.12 and 0.13 L methane /g COD removed in HRTs 6, 8 and 10 days while the yields slightly decreased to 0.08 and 0.09 L methane/gCODremoved in HRTs 0.2 and 2 days, respectively(data not shown) (ANOVA, R2= 0.79, F 3.89, p=0,0001,Perason r=0,77
The experimental data obtained in this work show that a level of alkalinity in the range of 2780 and 3200 mg/l as CaCO3 is sufficient to prevent the pH from dropping to below 7.8- 8.5 at al HRTs(data not shown). The TVFA/alkalinity ratio can also be used as a measure of process stability and as an index of acid base equilibrium of the process. When this ratio is less than 0.4–0.5 the process is considered to be operating favourably without the risk of acidification. The values of this ratio remained lower than 0.5 in all runs for both reactors showing that process failure did not occur in spite of the short HRTs used in this study(data not shown).
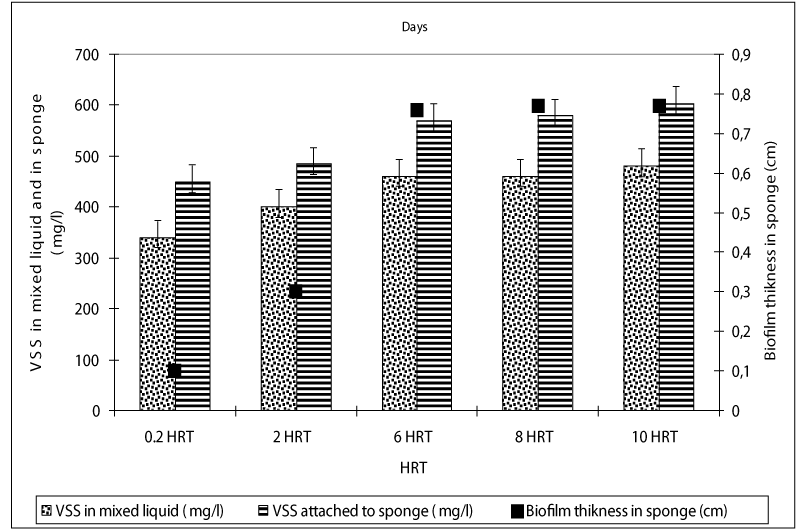
The VSS concentrations in liquid of the anaerobic batch reactors increased from an initial 40 mg/l up to 340 and 480 mg/l as the HRTs was increased from 0.2 up to 10 days, respectively (Figure 5). The VSS concentrations attached to sponge were measured as 450, 480, 560, 580 and 604mg/l at HRTs 0.2, 2, 6, 8 and 10 days. The higher COD, OTC and tylosin yields in anaerobic batch reactors at low HRTs such as 0.2 and 2 days could be attributed to the high VSS and attached VSS concentrations in the reactors metabolizing the antibiotics and the glucose-COD as secondary substates and carbon and energy source, respectively in anaerobic batch reactors.
Composition of bacterial communities
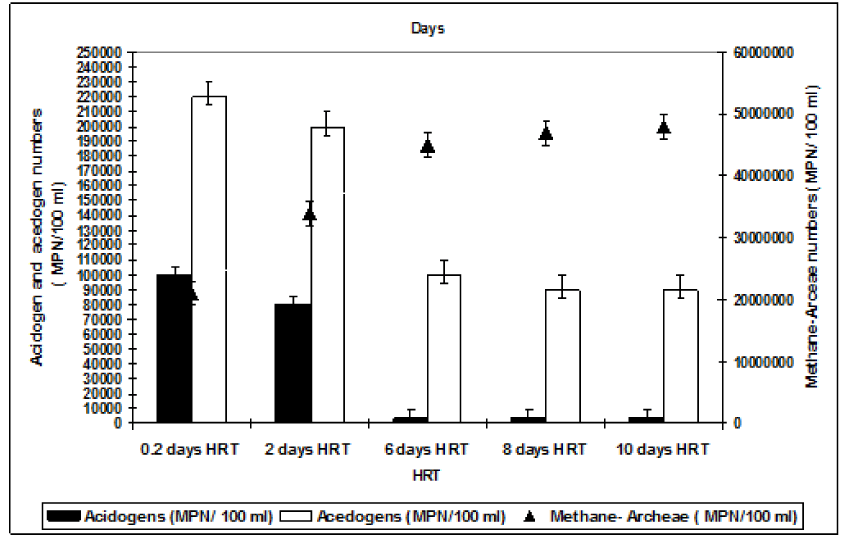
Analyses of composition of bacterial communities obtained from a sample of biomass adhering to the support the mixed liquor of the anaerobic batch reactors for all HRTs (Figure 6). It can be speculated that during anaerobic treatment 3 different microorganism group are dominated during hydrolisis, acidiphication-acetogenation and methanogenesis. Each group contained a lot of individial genous. Therefore the anaerobic attached and suspanded biomass can be referred as anerobic consortia. At the beginning of 45 days of operation period (on day 7), the total numbers of methanogenic bacteria were significantly smaller (67 x 102 MPN/100ml) than the acidogenic bacteria (23 x 106 MPN/ 100ml ). When the anaerobic reactor was operated at an HRT of 0.2 days the dominancy of acidogenesis was detected. The numbers of acedogenic bacteria are also high at this HRT since the fatty acids produced by hydrolysis began to use by the acedogens. The total number of methanogenic bacteria increased significantly up to 21 x 104 MPN/100ml and 13 x 107 MPN/100ml after 45 days of operation period at a HRT of 0.2 days while the number of acidogens and acedogens remained as the level of the start-up period. The numbers of total acidogenic and acedogenic bacteria are high at HRT 2 days compared to the HRTs 6, 8 and 10 days while the numbers of methane-Archaea were low at HRT 2 days. The numbers of total methanogens inceased from initial 45 x 102 EMS/ 100 ml up to 34 x 108 MPN/ 100 ml after 45 days of operation at a HRT of 6 days. The numbers of total methanogens were recorded as 47 x108 and 48 x 108 MPN/ 100 ml after 45 days of operation period at HRTs 8 and 10 days, respectively. This showed that after 45 days methanogenesis is the main removal mechanisms of COD and both OTC and TL antibiotics at HRTs 6, 8 and 10 days. At short HRTs although the numbers of methane Archaea are low they are showing a strong activity since the COD and both antibiotics are removed with high yields. This could be attributed to high specific methanogenic activities at HRTs as low as 0.2 and 2 days. This can be explained as follows: At the beginning of the 45 days operations the acidogen and acetogen bacteria are dominated in the acidogenic and acedogenic phases at low pH values in the aerobic reactors. When all the volatile fatty acides were converted to acetic acid; the alkalinity produced added to the anaerobic reactor provides to growth and dominate the methanogens at pH values beteen 7,0 and 8.5 in methanogenesis phase.
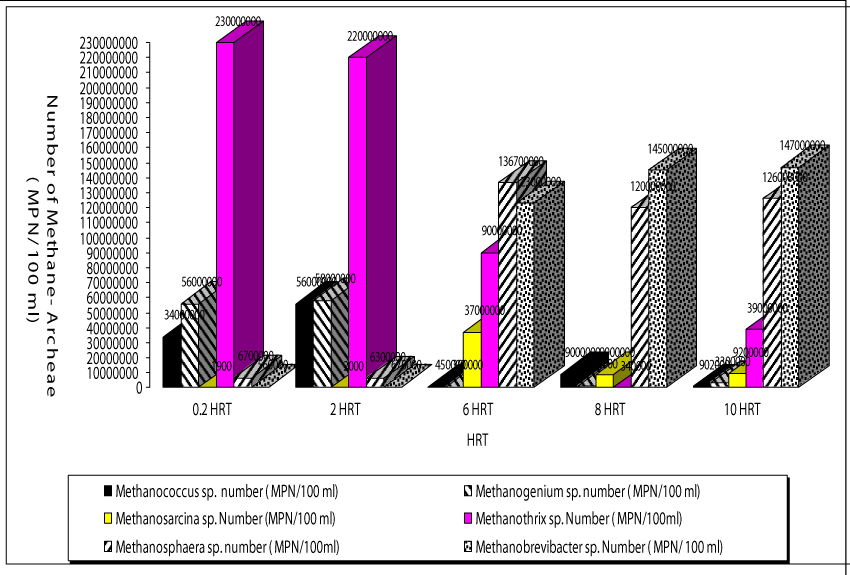
The operating conditions in the reactor with a HRT of 0.2 day mainly favored the presence of bacteria namely Methanothrix sp. This type of acetate-utilizing methanogen existed primarily when HAc concentrations were low (Figure 7). The HAc were low (180-220mg/l) at HRTs 0.2 and 2 days compared to the other HRTs (320-340mg/l) studied. The number of Methanothrix sp was 23 x 107 after 45 days of operation period. This type of Archaea is gram negative and has a flament shape. The numbers of the other most dominant members of the archaeal cells in the anaerobic reactors treating both OTC and TL were the genus Methanococcus sp and Methanogenium sp. at a HRT of 0.2 day. Their numbers were recorded as 34 x 105 and 56 x 106 MPN/100ml. Methanococcus sp. is coccus, gram-negative, obligately anaerobic, although tolerance to oxygen varies widely in some species.
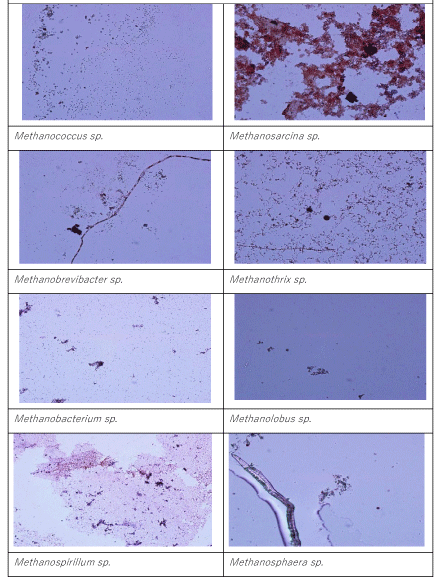
The members of genus Methanogenium sp. are among the most extensively known methane producers, is a gram negative bacillus type Archae. The main fermentation products from glucose of the last Archae mentioned above are not only CH4, CO2, butyrate and acetate but also butanol and H2. The numbers of Methanosarcina sp. and Methanosphera sp. were found to be low at HRT 0.2 days (19 x 102 and 8 x 10² MPN/ 100ml, respectively). Similar observations was detected at a HRT of 2 days. The names of Archae genus dominated at a HRT of 6 days were Methanobrevibacter sp. and Methanosarcina sp. Their numbers reached 19 x 107 and 12 x 108 MPN/100ml, while the numbers of Methanococcus sp. (45 x 103 MPN/ 100 ml) and Methanogenium sp. (39 X 103 MPN/100ml) are low compared to HRT= 0.2 days. These bacteria are growth at higher HAc concentrations (Figure 4) The number of and Methanosarcina sp. was lower (3 x 10³ MPN/100ml). Similarly, the dominated methane Archaea were Methanospera sp. and Methanobrevibacter sp. with 33 x 107 and 45 x 107 MPN/ 100 ml at a HRT of 6 days. The numbers of Methanococcus sp., Methanogenium sp. and Methanobrevibacter sp. and Methanosarcina sp. were 9 x 10⁴, 12 x 104, 23 x 106 and 9 x 10⁴ MPN/100ml, respectively, at a HRT of 8 days. The number of Methanothirx sp. was 34x 104 MPN/100ml. The high efficiency of methane production with simultaneous OTC and TL removals achieved in the anaerobic reactors with HRTs 6, 8 and 10 days. This could be attributed to bacterial composition and to the dominated Archae presented above. The maintenance of optimum alkalinity with pH values close to 8.5 and low VFA production favored the growth of these bacteria, which can utilize VFA and produce methane. The pictures of methanogenic Archaea isolated throughout the anaerobic biodegradation of the OTC and TL antibiotics are given in Picture 1. 17% of the bacteria consist from Methanothrix sp while the percentages of Methanococcus sp., Methanogenium sp. Methanobrevibacter sp. and Methanosarcina sp. were calculated as %18%, %19, 16% and 14%,respectively(data not shown). The percentage of Methanospeara sp.was calculated as%;14% and 14%, respectively. The percentage of Methanospeara sp.was calculated as 11% (data not shown)at 6 days HRT.The colonies of different bacteria in anaerobic reactors needed some time to acclimate with each other. The biomass growth increased for all HRTs and this can be referred to as log growth phase or an exponential phase which coincides with the maximum rate of biodegradation of the substrate (COD, OTC and TL removals), The COD, OTC and TL “which is considered as a food” must be plentiful in the reactor to maintain log growth.
The names of acidogenic bacteria identified throghout anaerobic biodegradation of OTC and TL were Streptococcus sp., Bacillus sp., E.coli, Aeromonas sp, Clostridium sp., Clostridium acetibutilycum , Desulfotomaculum sp. and Pseudomonas sp
Total and methane gas productions and methanogenic activity
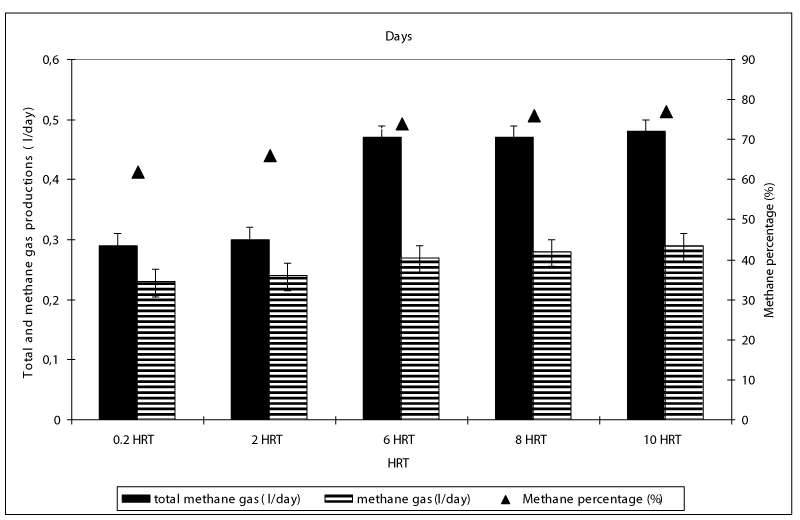
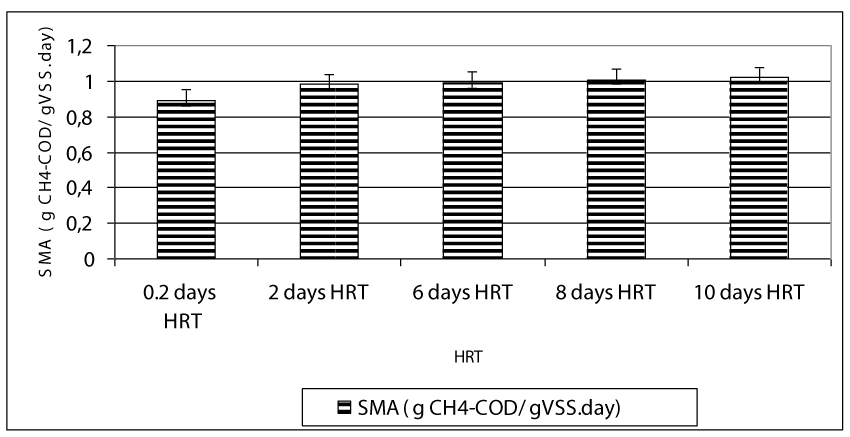
After hydrolysis, the soluble COD was firstly metabolized to VFA namely HAc, HBu and HPr by the acedogen bacteria at the first days of the operation periods while these intermetabolites were converted firstly to Hac and then they were ultimately converted to methane and to carbondioxide by methanogens. The total gas composition was mainly consisted of methane (75%) and carbondioxide (23%) while the rest of the total gas consisted of nitrogen (1%) and hydrogen sulphur gases (1%) (data not shown). Figure 8 shows the effect of HRT on total gas and methane gas productions in the anaerobic batch reactors treating 100 mg/l OTC and 200 mg/l TL in mixed form. The daily total gas and methane gas productions were about 0.3 l/day and 0.24 l/day, respectively until a HRT of 6 days (Figure 8). The maximum total gas and methane gas productions were found around 0.42-0.45 l/day and 0.26-0.28 ml/day, respectively, at HRTs 6, 8 and 10 days. This indicated the 0.48 l / day and 0.27- 0.29 l/day methane productions, respectively. The decreasing HRT did not significantly affect the methane gas production since the number and type of methane Archeae were not varied significantly (ANOVA, R2= 0.87, F= 3.87, p> 0,0001,pearson r=0,47 ). The methane percentage of the gas produced were 59 %, 63, 68, and 69% at HRTs 0.2, 2, 6, 8 and 10 days, respectively. Although the number of methanogens at HRTs 0.2 and 2 days are low compared to the other HRTs, the high methane gas productions and methane percentages could be attributed to high SMAs at low HRTs. High methanogenic activities at HRTs 0.2 and 2 days (0.87 and 0.98 g CH4-COD/g VSS day ) proved this hypothesis (Figure 9). The specific methanogenic activities were 0.99, 1.01 and 1.02 g CH4-COD/ g VSS day at HRTs 6, 8 and 10 days, respectively. It can be postulated that, higher methanogenic activity was responsible for the higher biogas productions in 6, 8 and 10 -days-HRT reactors. Since, the daily biogas productions were primarily affected by methanenogenic Archaeanogenic activity, also influenced the total biogas productions.
Multiple statistical analysis results showed that significant correlations between methane-Archaea numbers, specific metanogenic activity and HRTs was not observed. Although the number of Archaea at short HRTs are low; high methane productions, methane percentages and high antibiotic yields could be attributed to high SMA and dominated genus type of methane bacteria.
Equation 1 showed the dependency of methanogen numbers to the parameters given below:
Methanogen-Archaea number (MPN/100ml)=0.21 HRT (day)+0.0034 SMA(gCH4-COD/gVSS.day)-0.0056 OTC yield (%)-0.0087 TL yield (%)+ 0.000098 COD yield (%) (Eq. 1)
The results of this study were correlated with other recent studies: In a study performed by Mitchell, et al., the tylosin reduced the biogas production by 10-38% between 10 and 30 mg/L at a HRT of 7 days. Chellipan, et al. [5] found that the COD and tylosin removal efficiencies decreased from 79-83% to 56-68% as the tylosin concentrations was increased from 45 mg/l up to 90mg/ in an UASR reactor at a HRT of 4 days. As the HRT was decreased from 6 days to 2 days the COD and tylosin yields decreased from 92-93% to 72-78%. Tylosin has been considered inhibiting COD removal in anaerobic digestion. The impact of tylosin concentrations on archaeal activity was found to be significant. The numbers of archaeal cells and methanogens level decreased especially at low HRTs. The performance of the UASR decreased impotantly. Xin, et al., [13] investigated the effects of increasing OTC concentration (20, 50 and 80mg/l) on the changes of bacterial and archaeal communities at 37 ˚C during anaerobic digestion of a cow manure. The increasing OTC concentration affected the richness and diversity of the aforementined bacterial groups. The numbers of Flavobecterium sp. and Methanobrevibacter sp. are high at low SRTs while their number increased at high SRTs under acedogenic and methanogenic phases. The study performed by Krakat, et al., [14] Clostridia and Chloroflexi were identified as prominent and persistent group in the anerobic digestion of cow manure. Wang, et al., [15] and et Tabatabaei, et al., [16] reported that Bacteroida, Methanoculleus, and Methanosarcina are the dominant genus in the anaerobic treatment of grass and manure. Arıkan, et al., [17] reported that , the genus Flavobacterium and uncultured bacterium (JN256083.1) were the dominant bacterial communities after 50 day of anaerobic digestion under different concentrations of OTC. Approximately 60% removal of OTC was achieved in 64 days by anaerobic digestion at 35. 0C yielding a calculated value half-life for OTC of 56 days. Elevated temperatures, high biological activity, biologically transformed organic material affected the OTC and interactions between these factors reduced biogas production by 27% during anaerobic treatment. Yi, et al., [18] found that the presence of high concentration antibiotics in wastewater can disturb the stability of biological wastewater treatment systems and promote generation of antibiotic resistance genes (ARGs) during the OTC treatment in an UASB. COD removal rate of 83.2%, 78.5% and 68.9% was achieved at an organic loading rate of 3.3, 4.8 and 5.9 kg COD m-3 d-1, respectively at increasing OTC concentrations of 20, 40 and 50 mg/l. Zupančič [19] investigated the feasibility of anaerobic co-digestion of pharmaceutical waste fermentation wastes mixed with pig slurry and corn-grass silage was studied. With OLR of 1.5 kg m–3 d–1 achieved 70 % COD removal and methane production of 25.4 L d–1. With OLR of 9.2 kg m–3 d–1, the anaerobic treatment failed after 20 days. The toxic impact could be avoided with an OLR not higher than 2.0 kg m–3 d–1. Jabari, et al., [20] mentioned that the fermentative bacteria were abundant, particularly the proteolytic Clostridium species. These species hydrolyse the proteins to polypeptides and amino acids, while lipids are hydrolysed via oxidation to long-chain fatty acids, and glycerol and polycarbohydrates are hydrolysed to sugars and alcohols. After that, fermentative bacteria convert the intermediates to volatile fatty acids, hydrogen and CO2. The Euryarchaeota, which consist mainly of methanogenic bacteria, represented 15.9% of bacteria within the anaerobic digestor treating pharmaceutical wastewater. The Crenarchaeota, extreme thermoacidophiles, were also detected in the digestor with an abundance of 6.4%. At low HRTs the archaeal diversity limited. During the acidogenesis phase, organic matters are metabolised by fermentative microorganisms to primarily produce volatile fatty acids (acetate, propionate, butyrate, isobutyrate, valerate and isovalerate), but also alcohols, sulphide (H2S), CO2 and hydrogen. Acidogenesis leads to simplified products of fermentation, and the bacteria involved in this step may be facultative or strictly anaerobic. Strictly anaerobic bacteria of the genus Clostridium was detected in the anaerobic step of acid formation.
The recent studies mentioned above showed that at high OLRs and low HRTs the methanogenic population changed and decreased. At high OTC, TL concentrations the COD yields decreased significantly. The decreasing of HRT redused the gas productions. In our study at low HRTs the performance of the UASB reactor vas not changed significantly. This could be attributed to the type of the reactors used, to the dominated bacteria in the reactor, VSS production on sponge addition to microorganisms in the mixed liquor, to the operational conditions, to the low pH values for methanogens and to the temperature.
Conclusions
In this study it was found that low HRTs such as 0,2 and 2 days was not significantly affected the anaerobic reactor performance based on COD, OTC and TL yields. The optimum HRT for maximum OTC(98%), TL(80%) and COD (94%)yields was found to be 6 days in an anaerobic mixing reactor containing 500 mg/l attached biomass (VSS) on sponge. No TVFA acumulation was detected in the effluent at decreasing HRTs in the comparison with the long HRTs. HAc/HBu ratio decreased with decreasing HRT. The higher COD, OTC and tylosin yields in anaerobic batch reactors at low HRTs such as 0.2 and 2 days could be attributed to the high levels and activity of acedogens and methagen bacteria. The total number of methanogenic bacteria increased significantly up to 21 x 104 MPN/100ml and 13 x 107 MPN/100ml after 45 days of operation. The methanogenic Archaea isolated throughout anaerobic biodegradation of the OTC and TL were Methanothrix sp, Methanococcus sp., Methanogenium sp., Methanobrevibacter sp., Methanosarcina sp. and Methanospeara sp. The big part of the methane Archae consist of Methanococcus sp., and Methanogenium. The HRT appeared to cause not significant variations in the composition of the Archaeal microbial communities. The decreasing of HRT was not affected significantly the specific methanogenic activities. The activity values were 0.99, 1.01 and 1.02 g CH4-COD/ g VSS day at HRTs 6, 8 and 10 days, respectively. Although the wastewater containing antibiotics are designed to achieve high HRTs for efficient and stable operation in this study 80 % OTC and 70% TL removals was achieved at HRTs as low as 0.2 days. This was provided by the active biomass accomplished by immobilizing microorganism either as biofilm attached on the sponge media surfaces such as that in anaerobic filters.
- (2011) Bergey's Manual of Determinative Bacteriology. Link: https://bit.ly/2V3VVNZ
- Emad S, Elmolla, Chadhuri M (2011) Combined photo-Fenton–SBR process for antibiotic wastewater treatment. J Hazardous Materials 192: 1418-1426. Link: https://bit.ly/2V4FIYL
- Göbel A, McArdell C, Joss A, Siegrist H, Giger W (2007) Fate of sulfonamides, macrolides, and trimethoprim in different wastewater treatment Technologies. Science of The Total Environment 372: 361-371. Link: https://bit.ly/3c5Nngv
- Oller S, Malato S, Sanchez-Perez JA (2011) Combination of Advanced Oxidation Processes and biological treatments for wastewater decontamination-A review. Science of The Total Environment 409: 4141-4166. Link: https://bit.ly/2UJW9KW
- Chelliapan S, Wilby T, Yuzir A (2011) Tolerance of the antibiotic Tylosin on treatment performance of an Up-flowAnaerobic Stage Reactor (UASR), Water Sci Technol 63: 1599-1606. Link: https://bit.ly/34fDwBG
- Gartiser S, Urich, Elke, Alexy R, Kümmerer K (2007) Anaerobic inhibition and biodegradation of antibiotics in ISO test schemes. Chemosphere 66: 1839-1849. Link: https://bit.ly/2JHf9Uf
- Shimada T, Zilles JL, Morgenroth E, Raskin L (2008) Inhibitory effect of the macrolide antimicrobial tylosin on anaerobic treatment. Biotechnology and Bioengineering 101: 73-82. Link: https://bit.ly/3bVarOC
- Stone JJ, Clay SA, Zhu Z, Wong KL, Porath LR, et al. (2009) Effect of antimicrobial compounds tylosin and chlortetracycline during batch anaerobic swine manure digestion. Water Res 43: 4740-4750. Link: https://bit.ly/2yCuGCw
- Speece RE (1996) Anaerobic Biotechnology for Industrial Wastewaters (first ed.), Archae Press, Nashville, TN, USA. Link: https://amzn.to/34eTOei
- Sponza DT, Cıgal C (2009) Relationship between anaerobic consortia and removal efficiens in an UASB reactor degrading 2,4 DCP, Original Research Article Desalination 245: 1-18. Link: https://bit.ly/34eU39l
- (2005) Standard Methods for the Examination of Water and Wastewater, 20th edition, APHA-AWWA-WEF, Washington, DC, USA. Link: https://bit.ly/2V3qfrX
- Lee Hing-Biu, Peart TE, Suobada ML (2005) Determination of endoctring discrupting phenols, acidic pharmaceuticals and personal care products in sewage by solid phase exteaction in GC-MS, Journal of Cromatography A 1904: 122-129. Link: https://bit.ly/2UOBCVX
- Xin KE, Wang CY, Li RD, Zang Y (2014) Effects of oxytetracycline on methane productionand microbial communites during anaerobic digestion of cow manure. J Integrative Agriculture 13: 1373-1381. Link: https://bit.ly/2UKLC2l
- Krakat S, Schmidt S, Scherer P (2011) Potential impact of process parameters upon the bacterial diversity in the mesophilic anaerobic digestion of beet silage. Bioresource Technology 102: 5692-5701. Link: https://bit.ly/3bO0TF8
- Wang H, Fang M, Fang Z, Bu H (2010) Effects of sludge pretreatments and organic acids on hydrogen production by anaerobic fermentation, Bioresource Technology 101: 8731-8735. Link: https://bit.ly/3bURWKc
- Tabatabaei M, Sulaiman A, Nikbakht AM, Yusof N, Najafpour G (2011) Influential Parameters on Biomethane Generation in Anaerobic Wastewater Treatment Plants. 560. Link: https://bit.ly/2V3O038
- Arıkan OA, Sikora LJ, Mulbry SU, Rice C, Foster GD (2006) The fate and effect of oxytetracycline during the anaerobic digestion of manure from pharmaceutically treated calves 41: 1637-1643. Link: https://bit.ly/2x3YRSw
- Yi Q, Zhang Y, Gao Y, Tian Z, Yang M (2017) Anaerobic treatment of antibiotic production wastewater pretreated with enhanced hydrolysis: Simultaneous reduction of COD and ARGs. Water Res 110: 211-217. Link:
- Zupančič GD (2009) Anaerobic Treatment of Pharmaceutical Waste Fermentation Broth. Chemical and Biochemical Engineering Quarterly 23. Link: https://bit.ly/3aNqON4
- Jabari L, Gannoun H, Khelifi E, Cayol JL, Godon JJ, et al. (2016) Bacterial ecology of abattoir wastewater treated by an anaerobic digestor. Brazilian Journal of Microbiology 47: 48-59. Link: https://bit.ly/2xNZrE6
- Foltz J, Mottaleb MA, Meziani MJ, Rafiq Islam M (2014) Simultaneous detection and quantification of select nitromusks, antimicrobial agent, and antihistamine in fish of grocery stores by gas chromatography-mass spectrometry. Chemosphere 107: 187-193. Link: https://bit.ly/39GuleQ
- Yang S, Lin C, Lin A, Hong P (2011) Sorption and biodegradation of sulfonamide antibiotics by activated sludge:Experimental assesment using batch data obtained under aerobic conditions. Water Research 45: 3389-3397. Link: https://bit.ly/34cwnSV
Article Alerts
Subscribe to our articles alerts and stay tuned.
 This work is licensed under a Creative Commons Attribution 4.0 International License.

 Save to Mendeley
