Annals of Marine Science
Oceans’ surface pH-value as an example of a reversible natural response to an anthropogenic perturbation
Hans-Rolf Dübal1* and Fritz Vahrenholt2
2Department of Chemistry, University of Hamburg, Papenkamp 14, 22607 Hamburg, Germany
Cite this as
Dübal HR, Vahrenholt F (2023) Oceans’ surface pH-value as an example of a reversible natural response to an anthropogenic perturbation. Ann Mar Sci 7(1): 034-039. DOI: 10.17352/ams.000036Copyright License
©2023 Dübal HR, et al. This is an open-access article distributed under the terms of the Creative Commons Attribution License, which permits unrestricted use, distribution, and reproduction in any medium, provided the original author and source are credited.The anthropogenic emission of carbon dioxide (CO2) has influenced the pH values of the oceans’ surface. Observations show that for several decades, the surface pH value is declining with a simultaneously rising CO2 concentration. It is an important question to understand to what extent this process is reversible. Hence, in this study, the atmospheric carbon dioxide (CO2) partial pressure from 1850 to 2020 is derived from the chemical composition of the seawater, the mass action law, Henry’s law, and published literature data on the relevant equilibrium constants. A single exponential relaxation or equilibration time τ = 52 ± 10 years (or half-time of 36 ± 7 years) accounts for the anthropogenic perturbation due to emissions. The model is based on reversible mechanisms and simultaneously represents the atmospheric CO2 volume fraction with a standard deviation of 7 ppm and the oceans’ surface pH values. Projections until 2100 for various emissions include the possibility of recovery within decades.
Introduction
Besides global warming, the ongoing declining trend of the oceans’ surface pH value is another issue of concern in climate change. It is well known, that the declining pH of the oceans’ surface water is closely related to the rising partial pressure of CO2 in the atmosphere and its exchange with the oceans [1].
Our knowledge about this interaction goes back to Kurt Buch, the Finnish pioneer in ocean physical chemistry, who published a paper in 1933 [2] about the important role of the borate in the carbonate equilibrium and the pH value of the seawater. Revelle and Suess [3] referred to Buch’s work in their classic paper about the carbon cycle. Their kinetic model for the effect of anthropogenic CO2 emission on the carbon budget included an oceanic buffer factor based upon Buch’s finding, that accounts for a reduction of the CO2 absorption capability of seawater with declining pH value. This “Revelle factor” lies in the nature of the carbonate buffer and increases with declining pH value. It is now a widely used concept [4,5]. With this basis, ever more detailed box- and circulation models were developed [6-8] and several authors have analyzed the carbon fluxes between the atmosphere and oceans with lateral and temporal resolution [9-16].
Despite the numerous publications in this field, it is still disputed, whether and to what extent the accumulation of CO2 in the atmosphere and consequently the pH reduction of the surface seawater is irreversible. The tool of impulse response functions (IRF) was utilized to postulate a perpetual airborne fraction of the emitted anthropogenic CO2, that would never participate in the global source-sink equilibration process [17].
In this work, we describe a completely different approach to calculating the average ocean’s surface pH value and the atmospheric CO2 fraction from the chemical composition of the seawater and the equilibrium parameters of the mass-action law and Henry’s law. In the second step, the deviation from equilibrium is analyzed and quantified by means of an exponential relaxation time. We shall first focus on the ocean and atmospheric system. The influence of the long-term net terrestrial CO2 flux on these results, i.e. land use change versus biosphere, shall be discussed in the last section. Only one freely adjustable parameter, a relaxation time τ, is used in this model.
Methods
Oceans’ surface and atmosphere in equilibrium
The absorption of carbon dioxide and its subsequent reaction with water forms a carbonate equilibrium, containing dissolved CO2, hydrogen carbonate (HCO3-), and carbonate (CO32-) according to Eq. (1) and (2).
Applying the mass action law, Henry’s law, electroneutrality, and mass conversation to this chemical system, for a closed system and the ideal gas we get for the partial pressure of CO2 in the atmosphere (see Supplement):
with Vgas and Vaq being the volume of the gas phase (atmosphere) and the aqueous phase (oceans), respectively. ρaq is the density of the aqueous phase so Vaq ∙ ρaq is its mass. The K-values are the equilibrium parameters for equations (1) and (2). R is the gas constant and T is the absolute temperature of the gas phase. Activity and fugacity coefficients are assumed = 1 throughout this work. The parameters of this equation are described in more detail in the Supplement. The equilibrium coefficients including their dependencies on temperature and salinity are taken from refs [18-35]. The influence of Borate, Sulfate, Nitrate, and other alkaline is included.
According to Eq. (3) the partial pressure of CO2 increases with the number of carbon moles in all chemical forms of Eq. (1) and (2), nC, and with the concentration of protons [H+]. Hence, it increases with decreasing pH value.
Ocean and atmospheric field data
Eq. (3) was derived for equilibrium conditions and enables us to calculate the CO2 partial pressure as a function of the oceans’ surface pH value. The datasets used here are obtained from the European Copernicus program [https://www.eea.europa.eu/data-and-maps/daviz/yearly-mean-surface-sea-water-1#tab-chart_3], from Jiang, et al. [4], the CO2 emissions from the RCP database https://tntcat.iiasa.ac.at/, and the CO2 atmospheric concentrations are from Ritchie, et al. [36].
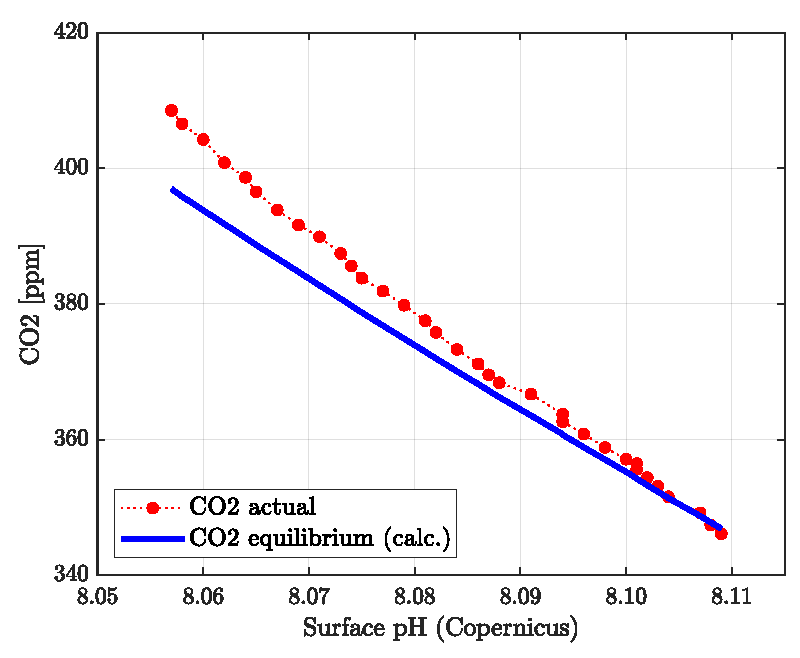
The result is presented in Figure 1 together with actual globally averaged pH field data published by the Copernicus program for the term 1985-2018. As expected, the actual CO2 partial pressure or volume fraction increases with declining actual surface pH. The blue line is calculated from Eq. (3) with nC = 2.93 E+18 which translates into 38452 Gt C in the whole oceanic and atmospheric system. This complies with the reported 38000-40000 Gt C [19,20,37].
The series of the actual data in Figure 1 is steeper than the equilibrium (calculated) values which indicate that the actual data are not equilibrated. As will be discussed below, neither the contemporary pH nor the CO2 volume fraction is identical to the equilibrium values obtained “ab initio” from the seawater surface composition. The actual pH is too low and the volume fraction of CO2 is too high compared with the equilibrium values obtained for the chemical composition of seawater.
Accounting for the Non-Equilibrium
The anthropogenic CO2 emission since 1850 was too large in too short a time to be fully equilibrated. Equilibration lags behind emission. The calculated equilibrium results for the year 2020 are pH = 8.10 and CO2 fraction = 335 ppm. The real data are pH = 8.05 and 414 ppm.
To account for incomplete equilibration, we use an exponential relaxation (or IRF, impulse response function) approach similar to Joos, et al. [17] and introduce a parameter z which is a number between 0 and 1. We find consistent results with z = 0.484 for the year 2020. This value means that the CO2 emitted since 1850, due to incomplete equilibration, had a larger effect on the pH and the CO2 volume fraction by 1/0.484 = 2.07-fold of the real emissions.
The quantity z(t) for a calendar year t ≥1850 is related to the equilibration time constant τ by:
and the quantity nC in Eq. (3) is then changed to:
with Ci are the annually emitted anthropogenic carbon mass of the calendar year I and MC denotes the atomic mass of carbon (MC = 12.011 g/mol).
Results
Modelling the data from 1850 to 2020
From 1850 to 2020 the total emissions were 593 Gt C = 2713 Gt CO2 [https://tntcat.iiasa.ac.at/]. This is the denominator for the year t = 2020 in Eq. (4) and also the summation term in Eq. (5). The first summation term in Eq. (4) discounts emissions according to their age. The value z (2020) = 0.484 corresponds to τ = 52 years and the half-time t1/2 is 36 years. In general, τ→∞ gives z→0 (slow equilibration), and a short-time constant τ→0 (fast equilibration) results in z →1. The longer τ, the larger the gain factor 1/MC∙z(t) in Eq. (5) and the deviation from equilibrium
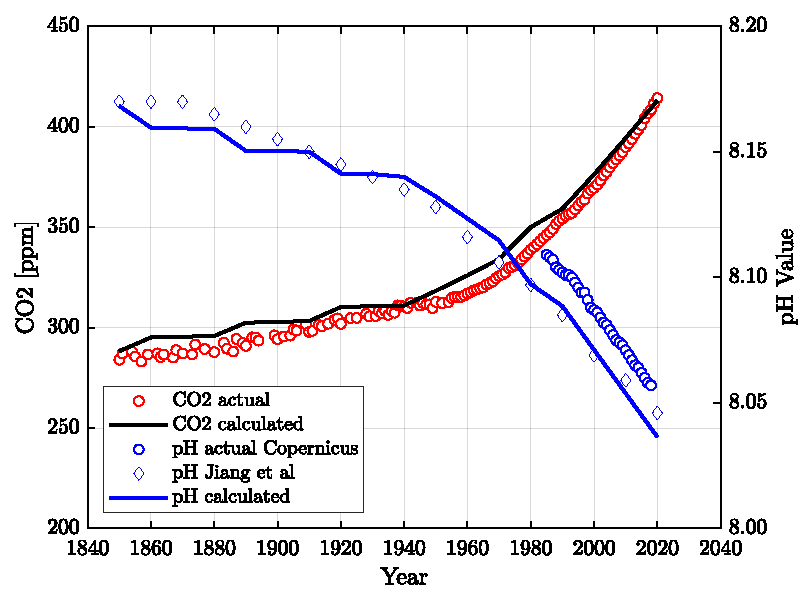
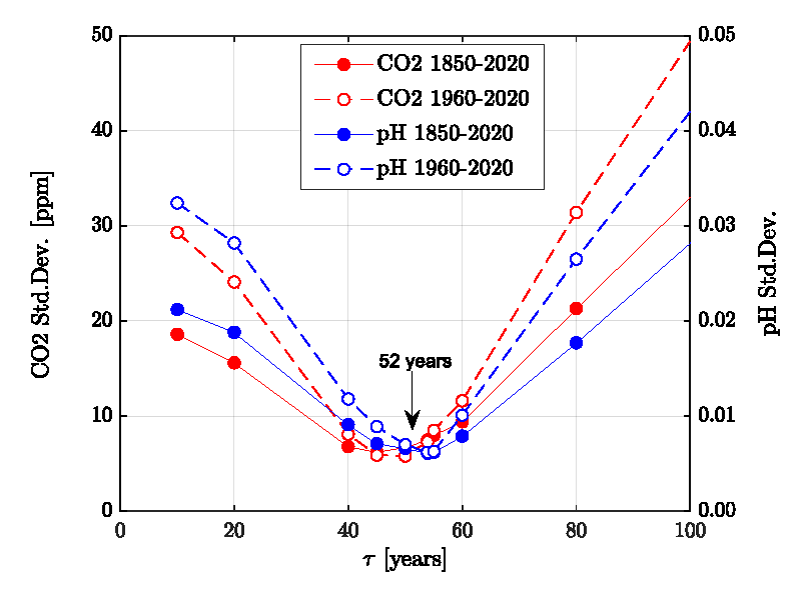
Figure 2 shows the results compared with actual data. Only one parameter, the time constant τ, was adjusted. All other parameters are either taken from the published literature or fixed to reasonably known values (see Supplement). The standard deviation for the CO2 is 7 ppm, and the pH is 0.015 units lower than the Copernicus data and agrees well (standard deviation = 0.006) with the data published by Jiang, et al. [4]. It is mentioned that the Revelle-Factor as an intrinsic property of the carbonate buffer system is implicitly included in these calculations. Figure 3 shows the standard deviations for a series of relaxation times τ both for the oceans’ surface pH value and the atmospheric CO2 content. It shows first a minimum range for τ between 40-60 years and a best value of τ≈52 years, and secondly that the position of the minimum is invariant to the time span considered here.
Projections for the oceanic surface pH-value and the atmospheric CO2 fraction
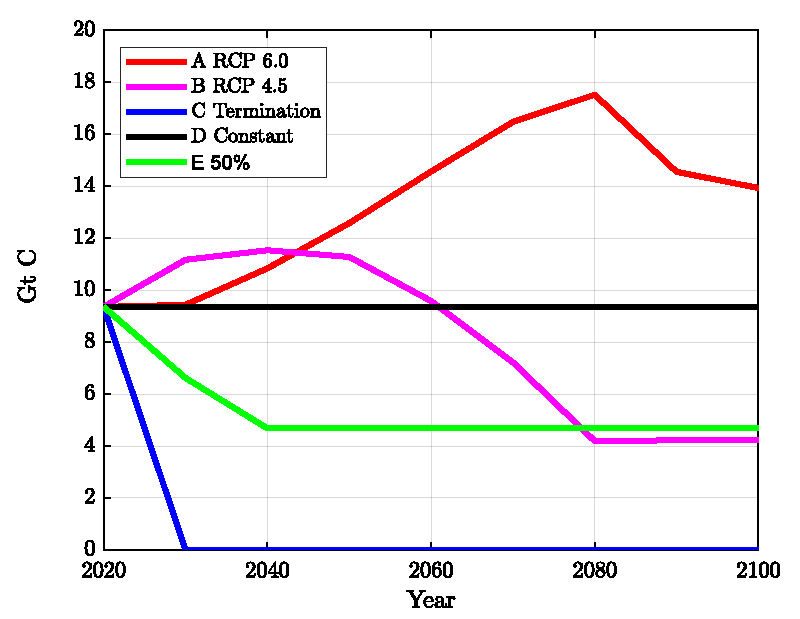
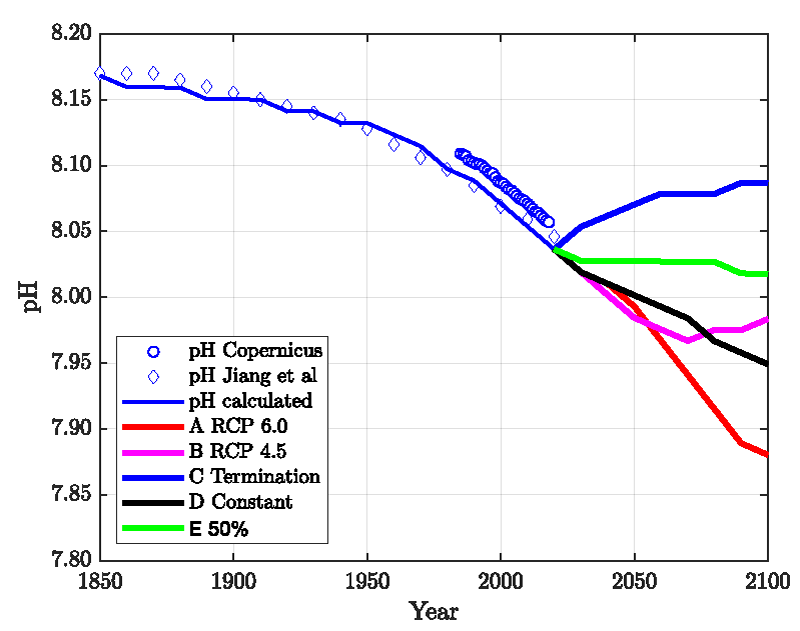
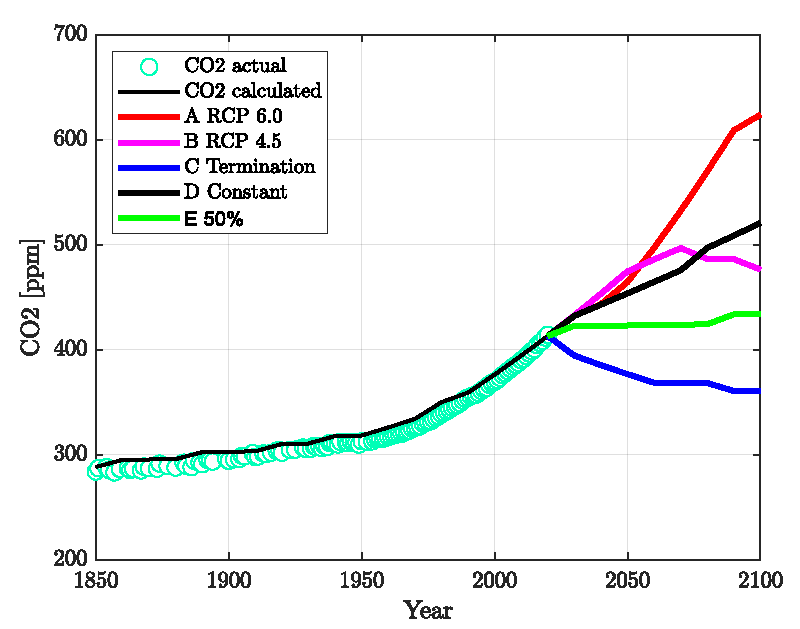
With the model described here and based upon the calculation shown in Figure 2 it is straightforward to calculate the effect of emission scenarios for 2021-2100. These are compared in Figures 4-6 and described below.
A. RCP 6.0: This is probably the most extreme, but still possible scenario. The emission data were obtained from the RCP database https://tntcat.iiasa.ac.at/
B. RCP 4.5: This is similar to scenario E) but with a longer adjustment time. The emission data were obtained from the RCP database https://tntcat.iiasa.ac.at/
C. Termination of Emissions: This scenario is unrealistic, but gives the lowest boundary.
D. Continue at Present Level: The emissions of 2020 are continued until 2100.
E. Continue with 50% of the Present Level: From 2021 to 2040 reduce down to 50% of the present emission, then stay constant on this level until 2100.
In Figure 4, we compare the emission scenarios and Figures 5,6 show the calculated ppm- and pH values.
Figure 5 exhibits the available field data (diamonds, circles) together with our model calculations (which are the same as in Figure 2 until 2020), extended until the year 2100 assuming the five emission scenarios A) to E) as shown in Figure 4. In Figure 6, the corresponding results for the atmospheric CO2 concentration is presented. The results show that a reduction of the CO2 emissions leads to a recovery of the pH and the CO2 content in agreement with the reversibility implied by the mass-action law.
Discussion
A 170-year-long history of CO2 atmospheric volume fraction values as well as published average ocean surface pH data including field data from 1985-2018 was compared with model calculations based upon the composition of the ocean water, published equilibrium coefficients, temperature, salinity, and a single adjustable relaxation time τ = 52 years or t1/2 = 36 years. The time constant represents the incomplete equilibration of the anthropogenic emission of carbon dioxide since 1850.
The role of the land and the terrestrial biosphere was not explicitly taken into account. The biosphere is currently a CO2 sink, as long as it is growing and becomes a CO2 source if declining. During the recent decades, the biosphere was predominantly growing and the net terrestrial flux, as reported in the paper of Friedlingstein, et al. [37-43] between 1960 and 2020 was a CO2 sink (a minus sign is used here) of ca. -0.9 ± 0.6 Gt C per year which is about 20% of the average anthropogenic emission during this period of time. The sign changed in the 1960s from source to sink. Sabine, et al. [10] have estimated a terrestrial net flux of +39 Gt C for the period 1800-1994 which is a source of ca. +0.2 Gt C per year. They also reported, consistently with Friedlingstein, et al. a value of -15 Gt C for 1980 to 1999, i.e. – 0.8 Gt C per year. Based upon these references, for the 170 years considered here, the terrestrial net flux was -0.1 Gt C/a which is ca. 3% of the anthropogenic emissions. But even assuming an extreme value of 10% of the anthropogenic emissions would result in only a slightly larger τ value of τ = 64 years or t1/2 = 47 years. Hence, the reported value of τ = 52 years or t1/2 = 36 years includes a small contribution from the biosphere.
Conclusion
As a key result, the concept described here is, to a large extent, reversible. This means that the recovery after reducing or terminating emissions happens in a shorter time than assumed in Jiang’s et.al. paper [4, Figure 5]. Contrary to the method described in our paper, we have not made use of CO2 fractions with different relaxation times as in [17]. All CO2 molecules follow the same laws, i.e., the mass-action law and Henry’s law. In particular, there is no perpetual airborne fraction of the emitted carbon dioxide in this model. If emissions stopped now, all of the carbon dioxides would equilibrate within a few decades, resulting in a lower ppm value and a higher ocean surface pH than today. If the present CO2 level of ca. 420 ppm is deemed uncritical, it can be maintained by cutting the emissions down to 50% (“net zero”). A full “decarbonization” is unnecessary in this respect.
Similar time constants, not exactly with the same definition as in this paper, but roughly comparable, were published by Jacobson et.al. [38,39] in their corrected version (30-95 years) in 2005, by Dietze in 2020 [40] (τ= 55 years), Halparin in 2015 [41] (t1/2 = 39.7 years), by Ollila [42] who reported a CO2 residence time of 32 years and by Dengler and Reid [43] who reported a half-life t1/2 of 42 years.
During the next decades, the results outlined here can be validated by considering the actual CO2 emission pathway and comparing the actual pH values and the actual CO2 concentration with the predictions that were considered in the literature. This will help answer the important question of the reversibility and recoverability of the impact of human emissions.
Details of the calculations and some experimental checks of Eq. (3) are available in the Supplement.
- Orr JC, Fabry VJ, Aumont O, Bopp L, Doney SC, Feely RA, Gnanadesikan A, Gruber N, Ishida A, Joos F, Key RM, Lindsay K, Maier-Reimer E, Matear R, Monfray P, Mouchet A, Najjar RG, Plattner GK, Rodgers KB, Sabine CL, Sarmiento JL, Schlitzer R, Slater RD, Totterdell IJ, Weirig MF, Yamanaka Y, Yool A. Anthropogenic ocean acidification over the twenty-first century and its impact on calcifying organisms. Nature. 2005 Sep 29;437(7059):681-6. doi: 10.1038/nature04095. PMID: 16193043.
- Book K. The boric acid content of seawater and its importance in the calculation of the carbonic acid system in seawater: Supplement to the report on the investigations carried out in the spring of 1931 in Helsingfors by a working committee of the International Marine Research. Rap Cons Explore Mer. 1933; 8571-75.
- Revelle R, Suess HE. Carbon Dioxide Exchange between Atmosphere and Ocean and the Question of an Increase of Atmospheric CO2 during the Past Decades. Tellus. 1957; 9(1):18–27. doi:10.3402/tellusa.v9i1.9075
- Jiang LQ, Carter BR, Feely RA, Lauvset SK, Olsen A. Surface ocean pH and buffer capacity: past, present and future. Sci Rep. 2019 Dec 9;9(1):18624. doi: 10.1038/s41598-019-55039-4. PMID: 31819102; PMCID: PMC6901524.
- Egleston ES, Sabine CL, Morel FMM. Revelle revisited: Buffer factors that quantify the response of ocean chemistry to changes in DIC and alkalinity. Global Biogeochem Cycles. 2010; 24(1). doi:10.1029/2008GB003407
- Oeschger H, Siegenthaler U, Schotterer U, Gugelmann A. A box diffusion model to study the carbon dioxide exchange in nature. Tellus A: Dynamic Meteorology and Oceanography. 2022; 27:168. doi:10.3402/tellusa.v27i2.9900.
- Hasselmann K. An ocean model for climate variability studies. Progress in Oceanography. 1982; 11(2):69–92. doi:10.1016/0079-6611(82)90004-0
- Maier-Reimer E, Hasselmann K. Transport and storage of CO2 in the ocean - an inorganic ocean-circulation carbon cycle model. Climate Dynamics. 1987; 2(2):63–90. doi:10.1007/BF01054491
- Orr JC, Maier-Reimer E, Mikolajewicz U, Monfray P, Sarmiento JL, Toggweiler JR, Taylor NK, Palmer J, Gruber N, Sabine CL, Le Quéré C, Key RM, Boutin J. Estimates of anthropogenic carbon uptake from four three-dimensional global ocean models. Global Biogeochem. Cycles. 2001; 15(1):43–60. doi:10.1029/2000GB001273
- Sabine CL, Feely RA, Gruber N, Key RM, Lee K, Bullister JL, Wanninkhof R, Wong CS, Wallace DW, Tilbrook B, Millero FJ, Peng TH, Kozyr A, Ono T, Rios AF. The oceanic sink for anthropogenic CO2. Science. 2004 Jul 16;305(5682):367-71. doi: 10.1126/science.1097403. PMID: 15256665.
- Mikaloff Fletcher SE, Gruber N, Jacobson AR, Doney SC, Dutkiewicz S, Gerber M, Follows M, Joos F, Lindsay K, Menemenlis D, Mouchet A, Müller SA, Sarmiento JL. Inverse estimates of anthropogenic CO 2 uptake, transport, and storage by the ocean. Global Biogeochem. Cycles. 2006; 20(2):n/a-n/a. doi:10.1029/2005GB002530
- Mikaloff Fletcher SE, Gruber N, Jacobson AR, Gloor M, Doney SC, Dutkiewicz S, Gerber M, Follows M, Joos F, Lindsay K, Menemenlis D, Mouchet A, Müller SA, Sarmiento JL. Inverse estimates of the oceanic sources and sinks of natural CO2 and the implied oceanic carbon transport. Global Biogeochem Cycles. 2007; 21(1). doi:10.1029/2006GB002751
- Gruber N, Gloor M, Mikaloff Fletcher SE, Doney SC, Dutkiewicz S, Follows MJ, Gerber M, Jacobson AR, Joos F, Lindsay K, Menemenlis D, Mouchet A, Müller SA, Sarmiento JL, Takahashi T. Oceanic sources, sinks, and transport of atmospheric CO 2. Global Biogeochem Cycles. 2009; 23(1):n/a-n/a. doi:10.1029/2008GB003349
- Takahashi T, Sutherland SC, Chipman DW, Goddard JG, Ho C, Newberger T, Sweeney C, Munro DR. Climatological distributions of pH, pCO2, total CO2, alkalinity, and CaCO3 saturation in the global surface ocean, and temporal changes at selected locations. Marine Chemistry. 2014; 16495-125. doi:10.1016/j.marchem.2014.06.004
- Takahashi T, Sutherland SC, Wanninkhof R, Sweeney C, Feely RA, Chipman DW, Hales B, Friederich G, Chavez F, Sabine C, Watson A, Bakker DC, Schuster U, Metzl N, Yoshikawa-Inoue H, Ishii M, Midorikawa T, Nojiri Y, Körtzinger A, Steinhoff T, Hoppema M, Olafsson J, Arnarson TS, Tilbrook B, Johannessen T, Olsen A, Bellerby R, Wong CS, Delille B, Bates NR, Baar HJ de. Climatological mean and decadal change in surface ocean pCO2, and net sea–air CO2 flux over the global oceans. Deep Sea Research Part II: Topical Studies in Oceanography. 2009; 56(8-10):554-77. doi:10.1016/j.dsr2.2008.12.009
- Gruber N, Clement D, Carter BR, Feely RA, van Heuven S, Hoppema M, Ishii M, Key RM, Kozyr A, Lauvset SK, Lo Monaco C, Mathis JT, Murata A, Olsen A, Perez FF, Sabine CL, Tanhua T, Wanninkhof R. The oceanic sink for anthropogenic CO2 from 1994 to 2007. Science. 2019 Mar 15;363(6432):1193-1199. doi: 10.1126/science.aau5153. PMID: 30872519.
- Joos F, Roth R, Fuglestvedt JS, Peters GP, Enting IG, Bloh W v., Brovkin V, Burke EJ, Eby M, Edwards NR, Friedrich T, Frölicher TL, Halloran PR, Holden PB, Jones C, Kleinen T, Mackenzie FT, Matsumoto K, Meinshausen M, Plattner G-K, Reisinger A, Segschneider J, Shaffer G, Steinacher M, Strassmann K, Tanaka K, Timmermann A, Weaver AJ. Carbon dioxide and climate impulse response functions for the computation of greenhouse gas metrics: a multi-model analysis. Atmos. Chem. Phys. 2013; 13(5):2793-2825. doi:10.5194/acp-13-2793-2013
- Dickson AG, Sabine CL, Christian JR. Guide to best practices for ocean CO2 measurements. Sidney, BC: North Pacific Marine Science Organization; 2007. 1 Band (verschiedene Seitenzählungen). (IOCCP report; 8). Eng.
- Jonas M, Nilsson S, Shvidenko A, Stolbovoi V, Gluck M, Obersteiner M, Oeskog A. Full Carbon Accounting and the Kyoto Protocol: A Systems- Analytical View; 1999.
- Sigman DM, Boyle EA. Glacial/interglacial variations in atmospheric carbon dioxide. Nature. 2000 Oct 19;407(6806):859-69. doi: 10.1038/35038000. PMID: 11057657.
- Dickson AG. Introduction to co2 chemistry in sea water. https://www.iaea.org/sites/default/files/18/07/oa-dickson-chemistry-1901015.pdf. 2016.
- Dore JE, Lukas R, Sadler DW, Church MJ, Karl DM. Physical and biogeochemical modulation of ocean acidification in the central North Pacific. Proc Natl Acad Sci U S A. 2009 Jul 28;106(30):12235-40. doi: 10.1073/pnas.0906044106. Epub 2009 Jul 27. PMID: 19666624; PMCID: PMC2716384.
- David D, Ingemar H. Ionic medium effects in sea water - a comparison of acidity constants of carbonic acid and boric acid in sodium chloride and synthetic sea water. Marine Chemistry. 1972-1973; 1137-149.
- Mehrbach C, Culberson CH, Hawley JE, Pytkowicx RM. Measurement of the apparent dissociation constants of carbonic acid in seawater at atmospheric pressure. Limnology and Oceanography. 1973; 18(6):897-907.
- Weiss RF. Carbon dioxide in water and seawater: the solubility of a non-ideal gas. Marine Chemistry. 1974; 2(3):203–15. doi:10.1016/0304-4203(74)90015-2
- Dickson A, Riley J. The estimation of acid dissociation constants in sea-water media from potentiometric titrations with strong base. II. The dissociation of phosphoric acid. Marine Chemistry. 1979; 7(2):101-9. doi:10.1016/0304-4203(79)90002-1
- Millero FJ. Thermodynamics of the carbon dioxide system in the oceans. Geochimica et Cosmochimica Acta. 1995; 59(4):661-77. doi:10.1016/0016-7037(94)00354-O
- Millero FJ, Roy RN. A Chemical Equilibrium Model for the Carbonate System in Natural Waters. Croatica Chemica Acta. 1997; 70(1):1-38.
- Lueker TJ, Dickson AG, Keeling CD. Ocean pCO2 calculated from dissolved inorganic carbon, alkalinity, and equations for K1 2 and K: validation based on laboratory measurements of CO in gas and seawater at equilibrium. Marine Chemistry. 2000; 70105-19.
- Liu Q, Fukuda K, Matsuda T. Study of Solution Process of Carbon Dioxide in Seawater. Journal of the JIME. 2006; 41144–9. doi:10.5988/jime.41.SI_144
- Herbert HS, Raymond DE. The Ionization Constant of Carbonic Acid in Water and the Solubility of Carbon Dioxide in Water and Aqueous Salt Solutions from 0 to 50 C. Journal of the American Chemical Society. 1943; 652030-7.
- Harned HS, Scholes SR. The Ionization Constant of HCO3 - from 0 to 50°. J Am Chem Soc. 1941; 63(6):1706–9. doi:10.1021/ja01851a058
- Sander R. Compilation of Henry's law constants (version 4.0) for water as solvent. Atmos Chem Phys 2015; 15(8):4399–981. doi:10.5194/acp-15-4399-2015
- Millero FJ, Graham TB, Huang F, Bustos-Serrano H, Pierrot D. Dissociation constants of carbonic acid in seawater as a function of salinity and temperature. Marine Chemistry. 2006; 100(1-2):80–94. doi:10.1016/j.marchem.2005.12.001
- Dickson AG. Thermodynamics of the dissociation of boric acid in synthetic seawater from 273.15 to 318.15 K. Deep Sea Research Part A. Oceanographic Research Papers. 1990; 37(5):755–66. doi:10.1016/0198-0149(90)90004-F
- Ritchie H, Roser M, Rosado P. CO₂ and Greenhouse Gas Emissions. Published online at Our World in Data.org. 2020. https://ourworldindata.org/co2-and-greenhouse-gas-emissions.
- Friedlingstein P, O'Sullivan M, Jones MW, Andrew RM, Gregor L, Hauck J, Le Quéré C, Luijkx IT, Olsen A, Peters GP, Peters W, Pongratz J, Schwingshackl C, Sitch S, Canadell JG, Ciais P, Jackson RB, Alin SR, Alkama R, Arneth A, Arora VK, Bates NR, Becker M, Bellouin N, Bittig HC, Bopp L, Chevallier F, Chini LP, Cronin M, Evans W, Falk S, Feely RA, Gasser T, Gehlen M, Gkritzalis T, Gloege L, Grassi G, Gruber N, Gürses Ö, Harris I, Hefner M, Houghton RA, Hurtt GC, Iida Y, Ilyina T, Jain AK, Jersild A, Kadono K, Kato E, Kennedy D, Klein Goldewijk K, Knauer J, Korsbakken JI, Landschützer P, Lefèvre N, Lindsay K, Liu J, Liu Z, Marland G, Mayot N, McGrath MJ, Metzl N, Monacci NM, Munro DR, Nakaoka S-I, Niwa Y, O'Brien K, Ono T, Palmer PI, Pan N, Pierrot D, Pocock K, Poulter B, Resplandy L, Robertson E, Rödenbeck C, Rodriguez C, Rosan TM, Schwinger J, Séférian R, Shutler JD, Skjelvan I, Steinhoff T, Sun Q, Sutton AJ, Sweeney C, Takao S, Tanhua T, Tans PP, Tian X, Tian H, Tilbrook B, Tsujino H, Tubiello F, van der Werf GR, Walker AP, Wanninkhof R, Whitehead C, Willstrand Wranne A, Wright R, Yuan W, Yue C, Yue X, Zaehle S, Zeng J, Zheng B. Global Carbon Budget 2022. Earth Syst Sci Data. 2022; 14(11):4811–900. doi:10.5194/essd-14-4811-2022
- Jacobson MZ. Control of fossil-fuel particulate black carbon and organic matter, possibly the most effective method of slowing global warming. J Geophys Res. 2002; 107(D19). doi:10.1029/2001JD001376
- Jacobson MZ. Correction to Control of fossil-fuel particulate black carbon and organic matter, possibly the most effective method of slowing global warming. J Geophys Res. 2005; 110(D14):n/a-n/a. doi:10.1029/2005JD005888
- Dietze P. Decarbonisation? The fatal error caused by false Carbon Models. Fachinfo 2020.
- Halperin A. Simple Equation of Multi-Decadal Atmospheric Carbon Concentration Change. defyccc.com, defyccc.com/se.
- Ollila A. Anthropogenic Carbon Dioxide (CO2) Amounts and Fluxes between the Atmosphere, the Ocean, and the Biosphere. PSIJ. 2015; 8: 1-17. doi:10.9734/PSIJ/2015/18625.
- Dengler J, Reid J. Emissions and CO2 Concentration-An Evidence Based Approach. Atmosphere. 2023; 14(3):566. doi:10.3390/atmos14030566

Article Alerts
Subscribe to our articles alerts and stay tuned.
 This work is licensed under a Creative Commons Attribution 4.0 International License.

 Save to Mendeley
