Annals of Marine Science
Electron Spin Resonance and Thermoluminescence dating of shells and sediments from Sambaqui (shell mound) Santa Marta II, Brazil
LM Oliveira1,2*, MB Gomes1,2, B Cortez1, MC D’Oca2, L Tranchina3, E Tomarchio4, A Parlato4, JFD Chubaci5, R Gennari5, RR Rocca6, F d’Errico7, S Sousa8, S Watanabe2 and M Marrale2
2Department of Physics and Chemistry “Emilio Segrè”, University of Palermo, Italy
3Advanced Technologies Network (ATeN) Center, University of Palermo, Italy
4Department of Engineering, University of Palermo, Italy
5Physics Institute, University of São Paulo, Brazil
6Marine Science Department, Federal University of São Paulo, Brazil
7University of Pisa, Italy
8Physics Department, Federal University of Aracaju, Brazil
Cite this as
Oliveira LM, Gomes MB, Cortez B, D’Oca MC, Tranchina L, et al. (2020) Electron Spin Resonance and Thermoluminescence dating of shells and sediments from Sambaqui (shell mound) Santa Marta II, Brazil. Ann Mar Sci 4(1): 001-007. DOI: 10.17352/ams.000017In Tupi, the word Sambaqui means “mound of shells”. These archaeological sites are cultural vestiges left by the prehistoric occupation of the Brazilian coast from five to six thousand years ago. Mollusks, fishes, and other marine edible foods were important for the survival of this population. The remains of foods, mainly shells, were heaped up, giving a mound of different proportions, which became part of the landscape of the Brazilian coastal plain. Due to the large number of Sambaquis in Brazil and considering that Sambaqui Santa Marta II, Laguna, SC, has not yet been dated, Electron Spin Resonance (ESR) measurements were performed in aragonite shells collected from different layers of Sambaqui Santa Marta II, starting from the base to the center of the Sambaqui. Radiocarbon analysis by Accelerator Mass Spectrometry (AMS) at Beta Analytic laboratory were also performed for comparison with ESR results. Before measurements, shells were chemically etched, after drying, were pulverized and sieved. The sediments were separated into small portions which were irradiated with gamma radiation from a 60Co source with doses from 5 up to 120 Gy. Ages around 2,000 to 4,000 years have been obtained. The results obtained are consistent with the dates of others Sambaquis of the region, possibly were built at the same time.
Introduction
Along the Brazilian coast, in many regions, sambaquis are found. Sambaquis are important cultural traces left by fishermen and collectors who have lived on the coast from 1,500 to 7,000 years ago. The word sambaqui comes from Tupi and means mound of shells, the main feature of this archaeological site [1,2].
The sambaquis have varied sizes from 2 to 3m in height and 5 to 10m in length at the base, but in Santa Catarina, in the region of Tubarão and Laguna, are found giant sambaquis with 10 to 50m in height and base with tens and hundreds of meters long [2].
Mollusks, fishes, and other marine edible foods were important for the survival of this population. The remains of foods, mainly shells, were heaped up, giving a mound of different proportions [2].
In Laguna the largest and most imposing Sambaquis in the world are found. The geographical situation of Laguna, in the Tubarão Delta, with rivers and lagoons, guaranteed abundance of sea food, favoring the feeding of these populations [3].
The Sambaqui Santa Marta II was built on a crystalline basement. The area of the site is 7000m2 and 50m high [3].
There is not much historical information about this archaeological site, its state of conservation is destroyed, for the use of its shells for paving roads and streets in Laguna city.
In this work thermoluminescence and Electron Spin Resonance techniques were used to date the sediments and shells collected from the Sambaqui Santa Marta II. Two shell samples were also dated by Radiocarbon method at Beta Analytic Laboratory to compare with ESR shells dating.
Samples were collected from several depths from the region considered base of sambaqui to the point as much as closest to the center. The age is expected to increase proportionally with the depth. However, the Sambaqui Santa Marta II was badly destroyed, much of its material was used for road paving by Laguna Prefecture. Probably the original format of the sambaqui was damaged.
The Santa Marta II Sambaqui, despite being one of Laguna’s giant sambaquis, has so far not been dated.
This paper presents the methods used in dating the materials collected from Sambaqui Santa Marta II.
Materials and methods
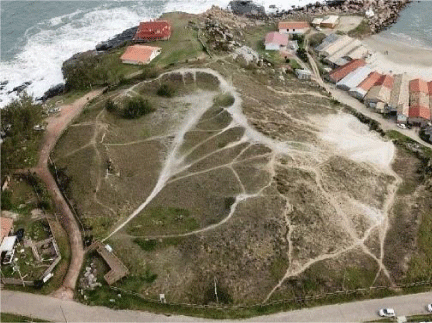
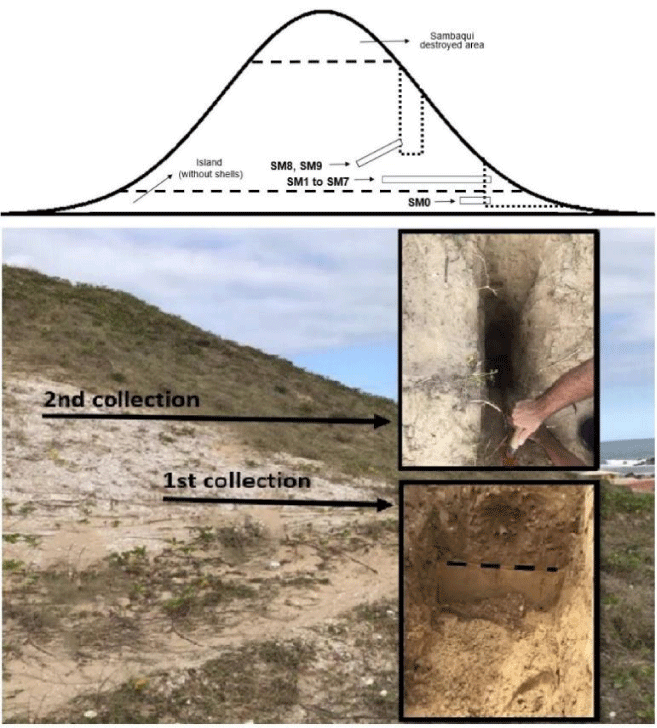
The Sambaqui Santa Marta II, shown in Figure 1, is located close to the Cape of Santa Marta, near the town of Laguna, state of Santa Catarina, Brazil (28°36’23.8”S 48°49’11.9”W). The site considered as the base of the sambaqui was identified. An 8m trench was made from the base of the sambaqui. On a vertical surface, a 50cm long (3cm diameter) PVC tube was inserted horizontally. During the collection, (Figure 2) it was identified that the sambaqui was built on a crystalline basement (island), the sediments of this part are clearer and less humid than the sediments present in the sambaqui, also have no shells in the considered island area, this sample was called SM0.
From the part considered sambaqui, 7 tubes were collected, the tube called SM1 was inserted above the tube SM0. The Sm2 tube was inserted at the same height as the SM1 tube, however, 1 m towards the inside of the sambaqui. The same occurred with tubes SM3, SM4, SM5, SM6 and SM7.
With the purpose to reach the central region of sambaqui, a second collection was made at Sambaqui Santa Marta II, at this time a 2m deep excavation was made 10m from the base, so the site was not badly damaged. Samples were taken from 2 points, 1.4 m and 1.6m deep, named SM8 and SM9, respectively. This time, the tubes were inserted diagonally downwards so as not to open a very large trench and damage the site.
The shells of each tube were separated from the sediments. For sample identification, the shells of each tube were called SMC1 and the sediments were called SMS1, and so on except the SM0 that contains only sediments.
After identification, a portion of the sediment from each tube was chemically washed with 40% H2O2, 37% HCl and 28% HF solutions, for 1h in each solution. The samples were washed with distilled water between etching procedures. H2O2 was used to eliminate organic particles. HCl forms chlorides from particles or metal compounds, and HF corrodes the surface of quartz grains enough to eliminate the effect of alpha rays.
In order to define the best procedure for chemical washing of the shells, a test was performed using acetic and chloridric acid solutions with different concentrations. The procedures used were based on the literature [4,5].
With this analysis, it was concluded that the 0.43M or approximately 2.5% (V/V) acetic acid solution was enough to eliminate alpha layer contribution. This acid percentage showed an evident color variation without large mass lossees. The choice of acid and concentration will depend mainly on shell thickness and size. The shells used in this work are of the species Anomalocardia brasiliana (Gmelin, 1791)(Bivalvia: Veneridae) are small and thin.
The shells were washed in an ultrasonic bath in distilled water to remove surface dirt and they were left for 1h in 0.43M solution.
After drying, both shells and sediments were ground and sieved, the grains with diameters between 0.080 and 0.180mm were retained for Thermoluminescence (TL) and Electron Spin Resonance (ESR) measurements. Shell grains with diameter smaller than 0.080 mm were used for crystal structure analysis by X-ray diffraction (XRD).
Shell powder samples were further chemically washed with 0.5% acetic acid for a few minutes to remove the g=2.0002 signal caused by grinding pressure [6].
Shell and sediment samples were separated into 500mg aliquots.
In order to identify the elements that compose the shell samples, a shell sample was chosen to perform the X-ray flourescence (XRF) measurement.
In order to obtain the value of accumulated dose (DAC), the sediments were analyzed by Thermoluminescence (TL) and the shells by Electron Spin Resonance (ESR). For TL measurements, sediments were irradiated with gamma radiation at doses of 5 to 100Gy and for ESR measurements, one aliquot was separated to determine the natural accumulated dose, with natural irradiation from the environment, and the other aliquots were irradiated at 10 to 60Gy doses. ESR analyzes were performed. The same aliquots were irradiated at 60Gy, totaling 70 to 120Gy doses.
To date sediment it is necessary to know the thermoluminescence acquired from when it was buried, the last time it was exposed to light and the thermoluminescence that the sample already had when it was buried. Usually, the thermoluminescent signal of a sample before being buried is high, which causes an overestimation of age [7].
Exposure to sunlight is sufficient to reduce the signal of natural thermoluminescence. However, there is a thermoluminescent residual signal that is not removed by solar radiation [8].
In order to estimate the internal and external annual dose, gamma spectroscopy technique was used. It is necessary to know the ppm contents of U-238, Th-232 and the percentage of potassium K-40 present in the environment from which the samples were collected (External dose) and within the sample itself (Internal Dose).
The result of gamma spectroscopy measurements with shells samples showed that the presence of natural radioisotopes inside the shell is negligible since the measured values were comparable to natural background radiation within the laboratory. On the basis of this result the contribution to the annual dose rate due to internal radioisotopes can be neglected.
To obtain the value of the annual dose rate in the environment where the shells were collected from, a portion of 25g of sediment from each collected tube was analyzed.
The percentage of water at the sample excavation site and the value of the cosmic radiation rate of the place where the sample was collected from are important parameters for calculating the annual dose. Water correction was calculated using equations 4.15, 4.16 and 4.17 from Ikeya [9] and cosmic radiation was calculated on the basis of the geographic coordinates of the site [10].
For the calculation of the external annual dose, the alpha radiation dose rate was neglected because the shells’ superficial layer was removed by chemical treatment [9].
With the results obtained, the values of beta and gamma radiation dose in mGy/year are calculated using table 4.5 from literature (Ikeya) [9].
The crystal structure of the shell was investigated by XRD technique using the MiniFlex 300 from Rigaku.
For XRF analysis of the samples, an X-ray fluorescence spectrometer Bruker Artax was used. A voltage of 50kV was applied on the X-ray tube and current of 700μA was chosen. The irradiation time for each point was 200s. The spectra obtained were interpreted by the Artax software present on the instrumentation.
TL measurements were performed using the Harshaw TL Reader 4500 equipment at a rate of 4°C/s.
To simulate solar illumination, the samples were exposed to xenon lamp (Xe) (Oriel Instruments - model 6427 60W), the energy used was 800mJ. The samples were placed at a distance of 65cm from the lamp and were exposed for varying time intervals, from 5 to 360min. After each exposure the thermoluminescence reading of each sample was taken.
ESR measurements were performed on the ESR Bruker ELExysis E580 spectrometer. The ESR spectra were recorded at 1mW microwave power and field modulation of 0.1mT.
Sediment samples were irradiated with gamma radiation at the CTR (Center for Radiation Technology), at IPEN (Institute for Energy and Nuclear Research). The multipurpose irradiator was used and the source used was 60Co. Shell irradiations with 60Co γ-photons (with mean energy of 1.25 MeV) were carried at the IGS-3 irradiator in the Department of Engineering at the University of Palermo.
The corrected accumulated dose value is obtained from Equation 1 [11].
where Dac,r is the corrected accumulated dose with residual TL value; TL0 is the natural TL and TLr is the residual TL.
Results and discussions
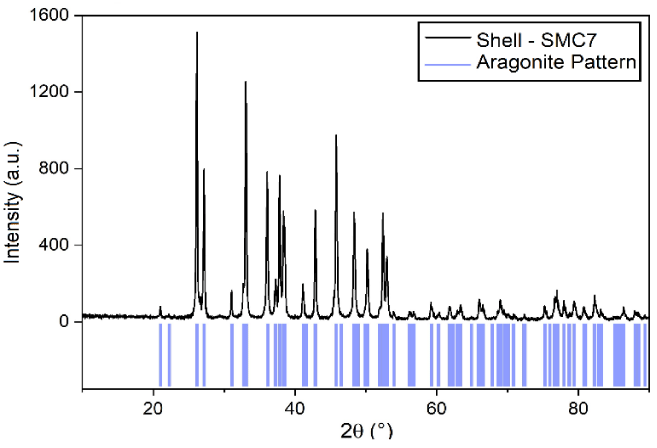
Aragonite shells are less common and less stable than calcite, and is readily converted into calcite at normal pressure and temperature [9]. The thermal instability of aragonite makes it less appropriate for dating by TL method, therefore, to date the shells samples, ESR technique was used. To identify the crystal structure of the shells collected from Sambaqui Santa Marta II, X-ray Diffraction analysis was performed. The result is observed in Figure 3.
The percentage of aragonite and calcite structure may vary in the same shell and it will depend on the mollusk and where it was developed [11,12]. The result obtained from the shell collected from Sambaqui Santa Marta II indicates that approximately 100% of the shell has an aragonite structure.
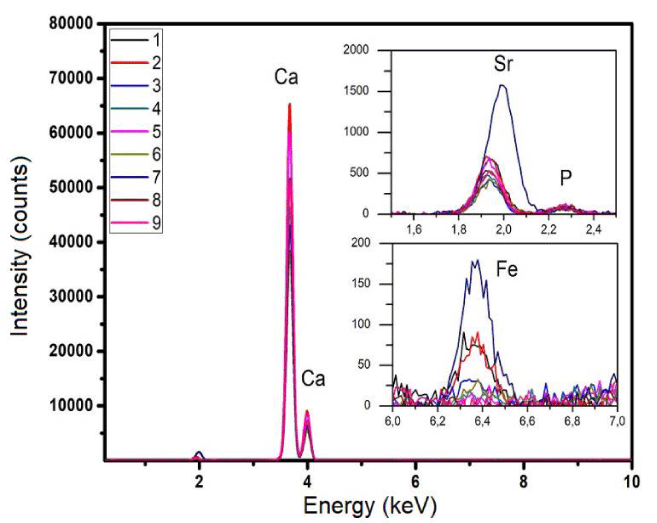
With XRF analysis it was possible to simultaneously determine the concentration of Ca, Fe, P and Sr elements. The result is shown in Figure 4.
The results of the evaluation of the annual dose rate are reported in Table 1.
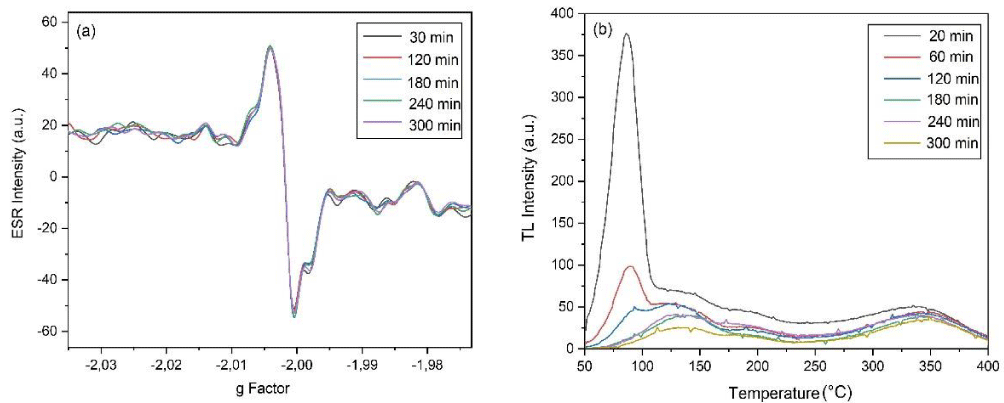
An anomalous fading test and reproducibility of sediment TL and shell ESR signals were measured. This test was performed to verify whether the intensity of the TL and ESR signals from sediments and shells are stable over the long term.
Sediments and shells samples were irradiated with a dose of 30Gy dose and 30min after, TL and ESR measurements were performed.
The peak decay of quartz results extracted from sediments and shells are shown in Figure 5. The decay as a function of the time taken for the shell sample was negligible. For sediments, a fading was observed. For the dating peak of 350°C, the thermoluminescence intensity decreased by about 30% between 20 and 60min. It was observed that after the first hour the thermoluminescent intensity of the high temperature peak stabilized.
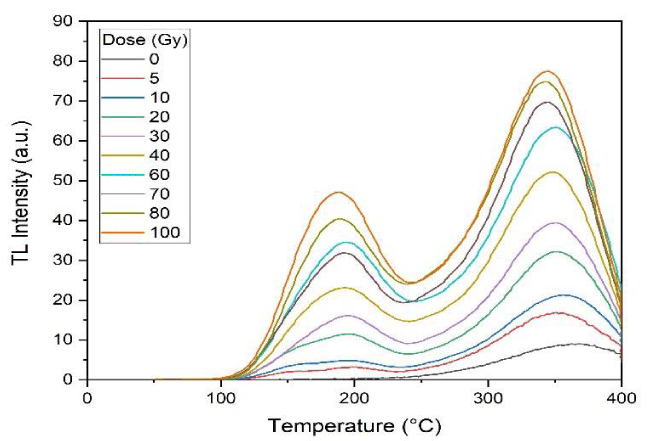
Figure 6 shows the behavior of the thermoluminescent intensity as a function of the temperature of the SMS9 sediment sample.
Quartz has 4 main peaks located at 110, 200, 325 and 375°C. A peak around 350° C is common, which is the combination between the peaks of 325°C and 375°C [7].
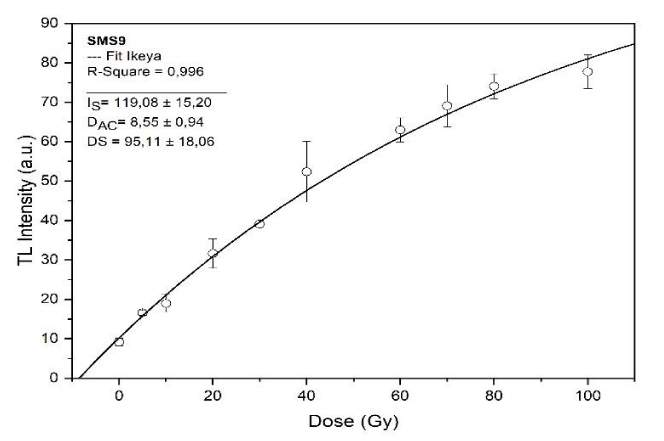
The result of Figure 6 shows 2 characteristic quartz peaks. The first at approximately 180°C and the second at 350°C. Samples that were naturally irradiated until the time of collection, i.e. samples that did not receive an additional artificial dose, show maximum peak height at approximately 375°C. For dating purposes, the peaks occurring from 300°C are chosen with the aim at ploting the dose-intensity curve of the TL response; the second peak was chosen because it is dose-dependent and more stable than the first one. Figure 7 presents the graphs of the intensity of the TL response as a function of the dose and the accumulated dose of the SMS9 sample.
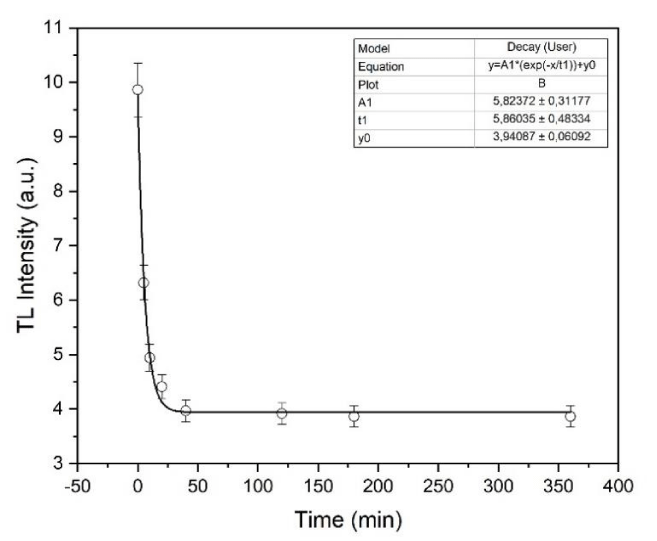
In order to fit the curve of TL intensity vs dose, the Equation 4.5 from Ikeya [9], was used. Correction of the accumulated dose taking into account residual TL was obtained by the additive method. Figure 8 shows the behavior of the TL response intensity curve as a function of sediment exposure time to the artificial lamp of the SMS3 sediment sample. The sediments were exposed from 5 to 360min.
With the residual TL test, it was possible to identify samples that had already been exposed to sunlight before collection: this is evident for SMS1 and SMS5 samples. The location of the SM1 tube sample near the edge of the sambaqui is one reason why the accumulated dose value is low: it is possible that part of the sambaqui top material has gone overboard, or because it is a shallow layer, solar radiation has reached this region of sambaqui. As previously mentioned, during the collection of samples SM5 and SM6 were found pipelines, the sediments of this region were also exposed to sunlight.
Testing for signal decay as a function of time is important to know if the dating signal is stable, reproducible, and if the same analysis is done after a period of time, the results will remain the same. The decay result of the thermoluminescent sediment signal showed that 30min after irradiation the signal is higher than from 1hour. The signal after 1h of irradiation showed stability. The decay test of the shell ESR signal showed no variation with time after irradiation. These results confirm with the literature [7,13] that both quartz and calcium carbonate have stable signals.
The residual TL results of corrected accumulated dose and age with and without residual TL correction are presented in Table 2.
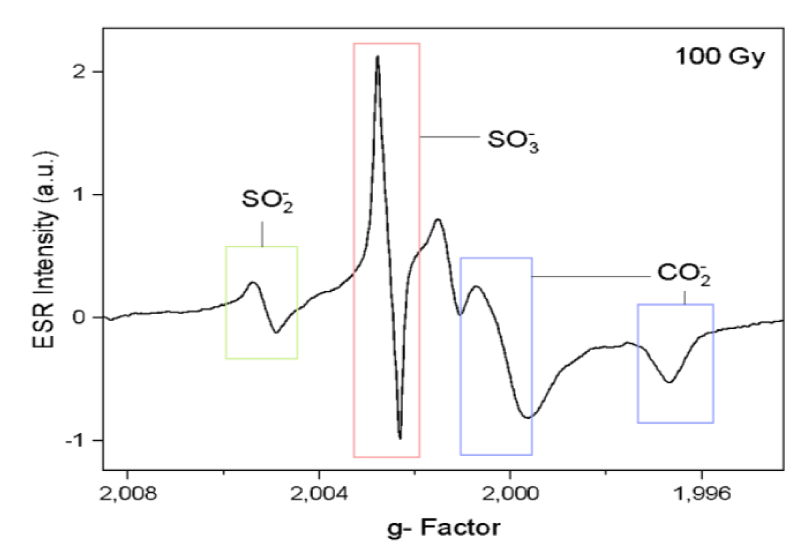
Figure 9 shows the ESR spectrum of shell sample (aragonite) after chemical treatment and irradiated with 100Gy γ-dose. In this figure the characteristic radical species intrinsic of aragonite structure were identified. The signal with g=2.0057 is related to the freely rotating SO2-, the g=2.0031 is related to isotropic SO3-, g=2.0007 is related to freely rotating CO2- and g=1.9973 is related to orthorhombic CO2- [9]. The signals usually adopted for dating are at g=1.9973 and g=2.0007.
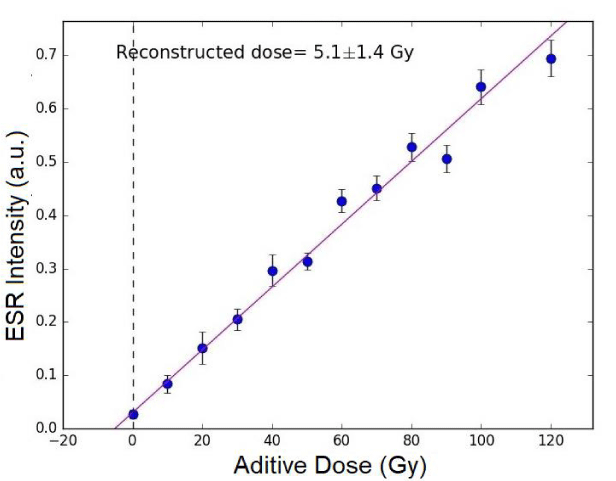
In order to fit the curve of ESR intensity vs dose, the Equation 4.5 from Ikeya was used [9].
From the curves of the ESR signal vs dose values, the respective DAC values were estimated for SMC3 shell samples, Figure 10. The graph was plotted using the negative peak amplitude of the center at g=1.9973. This peak was chosen because the accumulated dose value was consistent with the expected age for sambaquis sites in that region.
With accumulated dose and annual dose rate values, the age of the shells and sediments can be calculated. The results are presented in Table 3.
In order to compare radiocarbon and ESR results, two shells were dated by the accelerator mass spectrometry (AMS) technique by the Beta analytical laboratory. The ages value as shown in Table 4 are similar if we use g=1.9973 to SMC2 and SMC6.
The decrease in relative sea level 4,000 years ago, construction of sambaquis increased considerably [2]. For the values obtained from the sambaquis of the paleolaguna region of Santa Marta, most ages are between 4 and 2 thousand years.
The Santa Marta Sambaqui II is one of the giant sambaquis of the Santa Marta, Laguna, Santa Catarina region. As it is a giant sambaqui, it may have been built after low sea levels approximately 4,000 years ago.
Conclusion
The ages of the shells obtained by the ESR technique are between 2.2±0.7 and 3.8±1.2 thousand years. Radiocarbon measurements of two samples of shells from tubes Sm2 and SM6 resulted in the age of 3,300 years. Two pipes were found passing through the sambaqui. Undoubtedly, the sediments of the SM5 and SM6 tube layers were exposed to solar radiation and possibly the Sm2, SM4 and SM7 layer tubes were also affected.
The ages of sediments not exposed to sunlight obtained by the TL technique are between 2.00±0.49 and 4.07±0.53. Considering that the shells and sediments of the SM9 sample were close to the central point of the sambaqui, and the results of dating of the shells and sediments of this sample are of the same order of magnitude, it is estimated that the age when Sambaqui Santa Marta II began construction is between 3.8±1.2 and 4.1±0.5 thousand years BP.
To FAPESP for financial support - Grant 2017/12845-6 and for Research Internships Abroad – Grant 2018/19951-9 at University of Palermo (UNIPA).
To Prof. Alexandro Demanthé, GRUPEP – UNISUL for valuable help in the collection of samples.
To CTR-IPEN and Department of Engineering of the University of Palermo for irradiation of shells and sediments samples.
- Gaspar M (1999) Sambaqui: arqueologia do litoral brasileiro. Editora Zahar. Link: http://bit.ly/2GjTG1Z
- Deblasis P, Kneip A, Scheel-Ybert R, Fonseca Giannini PC, Gaspar MD (2007) Sambaquis e paisagem: dinâmica natural e arqueologia regional no litoral do sul do Brasil. Arqueologia suramericana 3: 29-61. Link: http://bit.ly/2RlRFbW
- Martins C (1997) Farol de Santa Marta: a esquina do Atlântico. Editora Garapuvu.
- Engin B, Yeşilyurt SK, Taner G, Demirtaş H, Eken M (2006) ESR dating of Soma (Manisa, West Anatolia–Turkey) fossil gastropoda shells. Nucl Instrum Methods Phys Res B: Beam Interactions with Materials and Atoms 243: 397-406. Link: http://bit.ly/38MgWC7
- Vichaidid T, Udorn Y, Pichet L (2007) Dating of aragonite fossil shell by ESR for paramagnetic species assignment of Mae Moh basin. Nucl Instrum Methods Phys Res B: Beam Interactions with Materials and Atoms 262: 323-328. Link: http://bit.ly/36p1bPR
- Griscom DL, Beltran-Lopez V (2002) ESR Spectra of limestones from the Cretaceous-Tertiary boundary: Traces of a catastrophe. Adv ESR Appl 18: 57-64.
- Aitken MJ (1985) Thermoluminescence dating. Academic press.Link: http://bit.ly/2TWCpUv
- McKeever WS, Moscovitch M, Townsend PD (1995) Thermoluminescence dosimetry materials: properties and uses. Nuclear Technology Publishing 28: 210. Link: http://bit.ly/2Rn4cM3
- Ikeya M (1993) New applications of electron spin resonance: dating, dosimetry and microscopy. World Scientific 520. Link: http://bit.ly/3aOD6FA
- Prescott JR., Stephan L (1982) The contribution of cosmic radiation to the environmental dose for thermoluminescence dating. Latitude, altitude and depth dependences. Pact 6: 17-25. Link: http://bit.ly/2TSoij3
- Chateigner D, Hedegaard C, Wenk HR (2000) Mollusc shell microstructures and crystallographic texturesJ Struct Geol 22: 1723-1735.Link: http://bit.ly/38AeRsB
- Cano NF, Turbiani-Filho TI, Gennari FR, Munita SC, Souza CM et al. (2013) TL dating of sediments from ilha do mel, brazil. Quaternary international 306: 137-145. Link: http://bit.ly/37Ac42o
- Wintle AG (1973) Anomalous fading of thermo-luminescence in mineral samples. Nature, Springer 245: 143-144. Link: https://go.nature.com/2TRd4LK

Article Alerts
Subscribe to our articles alerts and stay tuned.
 This work is licensed under a Creative Commons Attribution 4.0 International License.
 Save to Mendeley
