Annals of Marine Science
Intra-annual Variability of CO2 Flux in the Mahanadi Estuary- A Tropical Estuarine System, India
Suchismita Pattanaik1, Rajesh Kumar Sahoo1, Deepty Ranjan Satapathy1*, Chitta Ranjan Panda1, Saroj Bandhu Choudhury2 and Pradipta Kumar Mohapatra3
2Department of Space, National Remote Sensing Centre, Government of India, Hyderabad, Andhra Pradesh-500 037, India
3Department of Botany, Ravenshaw University, Cuttack, Odisha- 753 003, India
Cite this as
Pattanaik S, Sahoo RK, Satapathy DR, Panda CR, Choudhury SB, et al. (2017) Intra-annual Variability of CO2 Flux in the Mahanadi Estuary- A Tropical Estuarine System, India. Ann Mar Sci 1(1): 005-012. DOI: 10.17352/ams.000002The inorganic carbon dynamics and the CO2 flux of estuarine system are strongly influenced by the productivity and nutrient regime of water. This study provides full seasonal coverage of assessment of the physicochemical variables of Mahanadi estuary, mainly focusing on the carbonate system through the measurement of pH, Total Alkalinity (TA), Dissolved Inorganic Carbon (DIC), both aqueous and air fCO2, Dissolved Oxygen (DO) and chlorophyll a (chl a). The relationship of TA and DIC were found conservative throughout the study period. The estuary was found to be over-saturated with CO2 and acted as a net source. However, the magnitude of flux varied from season to season with a range between -8.14 to 58.09 µmol m-2 h-1 indicating ephemeral sink phase in the estuary. The air-water CO2 flux was primarily governed by fCO2 (water) although other factors such as temperature, pH, salinity, total alkalinity, wind speed and fCO2 (air) noticeably affected CO2 flux. A strong positive correlation was observed between temperature and inorganic nutrients during the study period. The study of net ecosystem metabolism justifies the heterotrophic nature of Mahanadi estuarine system.
Abbreviations
Chl a: Chlorophyll a; DIC: Dissolved Inorganic Carbon; DIN: Dissolved Inorganic Nutrients; DIP: Dissolved Inorganic Phosphates; fCO2(Air): Fugacity of CO2 in Air; fCO2(Water): Fugacity of CO2 in Water;
Introduction
The magnitude of flux determines the nature of an oceanic system to act as a net sink or source of atmospheric CO2 with the simultaneous activity of production and respiration [1,2]. The uncertainty in flux estimation results in complication in characterising an oceanic system [3,4]. Changes in land use and vegetation cover affect the carbon stocks which are responsible for the inter-conversion of a productive system to a heterotrophic one and vice versa [5-8]. The sink potential of an ecosystem is characterised by the solubility pump and the biological pump of CO2. The physical variables that are responsible for altering the solubility pump are temperature, salinity and wind velocity. The dissociation of carbonic acid to carbonate and bicarbonate is also a governing factor for solubility pump. On the other hand, the production of plant materials by autotrophic activities is related to the biological pump. Production of calcifying phytoplankton drive the calcium carbonate pump by releasing CO2 while the non-calcifying phytoplankton contributes to the organic carbon pump by absorbing CO2 in the uppermost layer of the ocean [9]. Part of the organic carbon is used and recycled in the upper surface layer through microbial processes and rest sinks down to the bottom and continues to decompose due to bacterial respiration. The intense anthropogenic perturbation in the coastal ocean alters the biological pump as well as the solubility pump and cause variation in the source-sink strength [10]. The nutrient upwelling significantly affects the biological pump causing phytoplankton bloom, while river run-off causes dilution and changes the solubility pump [11]. Hence, coastal ocean is a very dynamic system having variable source-sink strength due to the temporal and spatial variation in the input of terrestrial organic matter (makes the system heterotrophic) and nutrients (makes the system autotrophic) [12,13].
In general, the open ocean acts as a net sink for atmospheric CO2 with a magnitude ranging between -1.4 PgC yr-1 and -2.2 PgC yr-1 [14]. However, the role of the coastal ocean in global CO2 budget remains speculative due to the paucity of data [15,16]. The absorption of CO2 from continental shelves by the global extrapolation of air-water CO2 flux values or by compiling the data set of different continental shelves available in the literature is between -0.22 PgC yr-1 to -1.0 PgC yr-1 [15,17,18]. The global emission of CO2 by estuaries to the atmosphere is 0.27 PgC yr-1 [16]. Frankignoulle et al. [6], showed that the CO2 emission was between 0.03–0.06 Pg C yr−1 which represents 5 to 10% of anthropogenic CO2 emission for Western Europe.
Estuaries in India are driven by monsoonal rainfall. Hence, the biogeochemical cycling of materials during discharge period is far different from the dry period [19]. During peak discharge period, the estuary assumed riverine condition while in other seasons, the estuary is expected to be dominated by seawater influence [20-22]. Hence, the objective of this study was to determine the seasonal behaviour of CO2 absorption/emission in the Mahanadi estuarine region and to characterise the biogeochemical processes that prevail the estuarine system.
Materials and Methods
Geographical settings of study area
The Mahanadi river system is the third largest in the Indian peninsula and the largest river system in the state of Odisha, The basin (19º20’to 23º35’N and 80º30’-86º50’E) has a total length of 851 km, extending over an area of ca 141,600 km2 (65628 km2 in Odisha) and a pick discharge of 44,740 m3 s-1 [23]. The river begins in the Baster plateau in Raipur district of Chhattisgarh, flowing over different geographical formations of Eastern Ghats and joins the Bay of Bengal after divided into a network of branches in the deltaic area. The main branch of Mahanadi River meets the Bay of Bengal at Paradip. From the environmental features and topographic point of view, the estuarine system of Mahanadi River has been ranked as a tide-dominated coastal plain and the tidal estuarine part of the river covers a length of 40 km and has a basin area of 9 km2 [23].
Anthropogenic influence
The River Mahanadi receives water from the industrial cities of Sambalpur, Cuttack, Bauda, Choudwar, Jagatpur and Paradip. It also receives effluents from some industries like fertiliser, paper textiles, and agriculture run-off along its course from various cities [24,25]. The major anthropogenic influence has been ascribed by mainly three populated urban settlements on the banks of the river, namely Cuttack, Sambalpur and the port city Paradip due to the propagation of industries. The river contributes as a significant source of Domestic water supply to many cities on its bank and consequently it receives back the untreated domestic water and industrial effluents from different industries situated near side to the river.
Sampling strategy
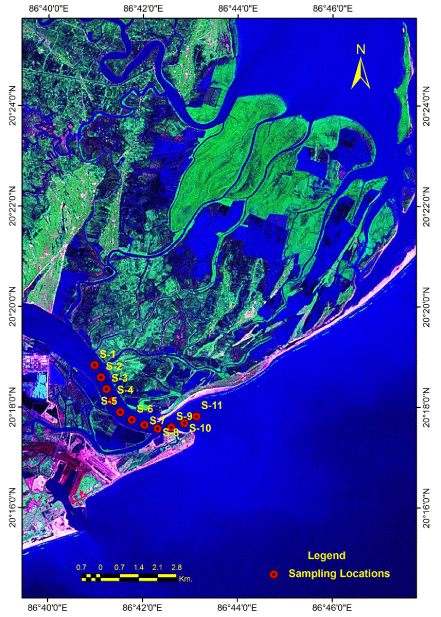
Indian Meteorological Department (IMD) designates four climatological seasons such as winter (December - March), summer or pre-monsoon (April - July), Monsoon or rainy (July - September) and post-monsoon or autumn (October - November). Accordingly, the sampling was carried out at 11 different stations in the Mahanadi estuary twice during each season following the IMD seasonal pattern. The surface samples (few centimeters below the sea surface) were collected by hiring trawlers.
Salinity, pH and temperature were immediately measured on site by using WTW kit (WTW model multi 340) fitted with Sentix 41 probe for pH and Tetracon 325 probe for temperature and salinity. Before each sampling, the pH electrode was calibrated with the standard pH buffers (WTW Technical Buffer Model TEP Trace) having pH at 4.01, 7.00 and 10.01. The water samples for DO analysis were collected in the glass stopper bottles. The samples were immediately fixed and then determined by Winkler’s method modified by Grasshoff [26]. Gross primary productivity (GPP) and community respiration (CR) were measured following the DO method of APHA [27] using in situ light and dark bottles incubation. The dark bottles were wrapped with black tape and aluminium foil. The dissolved oxygen in both light and dark incubated samples was fixed immediately upon retrieval. The changes in DO concentrations in light bottles between initial and after incubation were used as a measure of Net Primary Production (NPP). Changes in DO in dark bottles were used to quantify CR. GPP was estimated as the sum of NCP and CR. The metabolic rates measured using changes in DO concentrations were converted to carbon units assuming a photosynthetic quotient 1.25. The water samples were preserved and analyzed as per standard methods [27]. Dissolved inorganic nutrients (nitrate, nitrite, ammonia, silicate, and phosphate) were determined by standard spectrophotometric methods [28] using Varian 50 bio UV-visible spectrophotometer. TA and pH (for concurrence and these values have been presented in the text) were determined by potentiometric (Metrohm 905 Titrando, Switzerland) Gran titration method. 40 mL of measured sample was titrated against an accurately standardized 0.1 N sulfuric acid. The sulfuric acid was standardized by analytical grade sodium carbonate (Merck). Total Organic Carbon (TOC) was estimated using Elementar-Vario-TOC analyzer. The analyser was standardised with potassium phthalate and sodium carbonate. The temperature of the combustion tube was maintained at 850 °C for the catalytic combustion of the water sample. The fCO2 (water) and DIC were computed using measured salinity, temperature, pH, nutrients (phosphate and silicate) and alkalinity with the help of CO2SYS.EXE software [29]. The dissociation constants K1 and K2 were used according to Peng et al. [30]. Apparent oxygen utilization (AOU) was calculated using the solubility equation of Benson and Krause [31]. The concentration of CO2 (in parts per million) in the overlying atmosphere was determined by a non-dispersive infrared gas analyzer (Li-840A CO2/H2O gas analyzer, Li-COR Inc., USA), 10 m above the water surface water. The analyzer was calibrated with the help of three gases—one having CO2-free air and the other two having a certified standard of high concentration of 300 and 600 ppm of CO2, respectively (Indian Refrigeration Stores, Kolkata, West Bengal, India). The measured CO2 in ppm was converted to fCO2 (air) using the virial equation of state [32]. The wind speed data was obtained from the IMD.
The suspended particulate matter was measured by filtration methods implementing the gravimetric technique. Chl a of water samples were measured by filtering 1000 mL of water sample through Whatman GF/F (47mm diameter) using parallel filtration under low vacuum pressure. After filtration chl a was immediately extracted by immersing the filter paper in 10 mL of 90% acetone (Merck) and preserved at 4 °C for overnight extraction. The digest was centrifuged at 5000 rpm for 15 minutes and the absorbance of the supernatant was measured with a spectrophotometer [33] and the values were quantified using the equations of Jeffrey et al. [33].
Air-water CO2 exchange
Flux densities (µmol m-2 h-1) across the water–atmosphere were calculated according to the expression
where ‘k’ is the Gas Transfer Velocity (cm h-1), ‘β’ is the Ostwald dilution Coefficient (mol m-3 atm-1) and ∆fCO2 is the difference in fugacity of CO2 between water and air, [fCO2 (water) - fCO2 (air)]. Gas transfer velocity ‘k’ (cm h-1) was calculated according to the equation [34]
where u10 is vand the Schmidt number (Sc) for CO2 was evaluated as per the formula,
where A = 1992.1, B = 121.86, C = 3.54, D = 0.04227 and t = Temperature (oC) of water [35]. The positive magnitude of fCO2 interprets flux from water to air and vice versa.
Results and Discussion
Hydrodynamic characteristics
The surface temperature of Mahanadi estuary (Table 1) was found to be higher in monsoon (30.96 ± 0.32 °C) and lower in winter (24.4 ± 0.20 °C) and did not show any strong spatial variation throughout the study period. The distribution of pH was found to be higher in post-monsoon (8.07 ± 0.06) as the river was derived of run-off and lower in monsoon (7.84 ± 0.08). As expected low saline water was observed during monsoon (4.08 ± 0.34 psu) due to the fresh water supply to the estuary and higher during pre-monsoon (13.14 ± 4.44 psu). A load of suspended particulate matter was recorded high during monsoon (167 ± 73.7 mg L-1) and lower (7.04 ± 1.55 mg L-1) during post-monsoon. Dissolved oxygen concentration was found to be higher during post-monsoon (7.42 ± 0.46 mg L-1) followed by low AOU (-16.34 ± 14.20 µmol kg-1) and low during monsoon (6.16 ± 0.21 mg L-1) followed by high AOU (14.25 ± 6.92 µmol kg-1). There was a wide seasonal variability of dissolved inorganic nutrients among the seasons. The higher values of DIN and DIP were recorded in monsoon (15.86 ± 0.90 µmol L-1 and 5.92 ± 1.81 µmol L-1 of DIN and DIP, respectively) whereas the lower values were obtained during winter (3.47 ±0.85 µmol L-1 and 0.38 ± 0.16 µmol wL-1). The concentration of chl a was found to be high in pre-monsoon (4.57±0.78 mg m-3) and low in winter (1.76±0.52 mg m-3).
CO2 dynamics
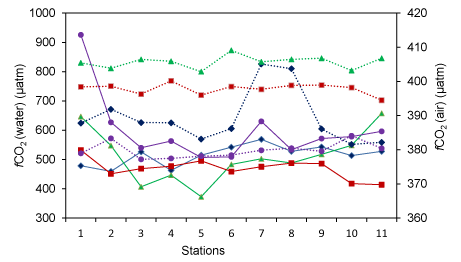
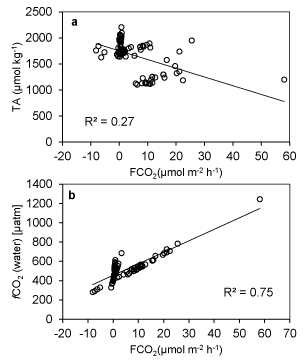
Seasonal variation of carbon components in Mahanadi estuary is depicted in Table 2. The River Mahanadi discharges freshwater into the estuary during monsoon which is loaded with both allochathonous organic carbon and inorganic nutrients. However, the CO2 concentration was supersaturated during monsoon (598 ±161 µatm). The fCO2 (water) showed wide variation in Mahanadi estuary (Figure 1). It varied between 281-1244 µatm throughout the year. The low fCO2 (water) value was observed during post-monsoon (469 ± 83 µatm) due to less input of terrestrial carbon. The fCO2 (water) value observed was somehow close to the previous report (~615-1807 µatm) by Ganguly et al. [36]. However, the concentration of CO2 in other Indian estuaries was found to vary widely: Godavari estuary- ~221-34026 µatm [37], Hooghly estuary- 234-518 µatm [38], Mandovi estuary- ~4993 [39], Zuari estuary- ~2076 µatm [39], Krishna estuary- ~7473 µatm [40], Cauvery estuary-~2989 µatm [40]. The CO2 level observed in Indian estuaries is governed by two biological phenomena such as heterotrophic respiration and autotrophic production. The dominance of one phenomenon over the other varies from the estuary to estuary. In Cochin estuary [41], Chillika estuary [41], Mandovi and Zuary estuaries [39], high level of CO2 is associated with heterotrophic respiration than autotrophic production. In the Mahanadi estuary, the CO2 level is dominated by autotrophic production throughout the year. However, the magnitude of production varies from season to seasons. In addition to this, the fCO2 (water) showed a negative correlation with dissolved oxygen concentration (R2-0.30) suggesting intense oxygen utilisation for decomposition of organic matter thereby decreasing pH. The highest average value of fCO2 (air) was observed during pre-monsoon (408 ± 2.98 µatm) and the lowest average value was found to be 380 ± 2.97 µatm in monsoon. The Δ fCO2 value ranged between -122-864 µatm throughout the year. As the variation of fCO2 (air) was found to vary in a narrow range of 376-411 µatm, therefore it can be stated that the Δ fCO2 was mainly influenced by fCO2 (water) (Figure 2). There was a conserved relationship between TA and DIC in the Mahanadi estuary throughout the study period. TA was found to vary between 1102-2206 µmol kg-1 during the observation period. However, TA and DIC were found maximum with an average value of 1937 ± 132 µmol kg-1 and 1855±125 µmol kg-1, respectively during winter and minimum 1211 ± 93 µmol kg-1 and 1181±92 µmol kg-1, respectively during monsoon. Concentration levels of these two parameters, observed in Mahanadi estuary during monsoon, were much lower as compared to the previous report by Sarma et al. [37], (1951± 132 µmol kg-1 and 1590 ± 40 µmol kg-1, respectively). The difference may be attributed to the sampling sites of the two studies. The inner estuary is taken for the present study, while Sarma et al. [37], selected sampling sites in the offshore region. Further, a significant change in the catchments of the river system has also occurred during this period and this is expected to influence the TOC input into the estuary, thus altering the DIC. There was a significant strong positive correlation between TA and DIC (R2-0.99). It may be noted that the DIC is dependent on carbonate alkalinity and the relationship in such case is more or less inverse. However, the direct relationship between DIC and TA in present case infers that the observed alkalinity in Mahanadi estuary is more of non-carbonate type.
Effect of temperature and salinity
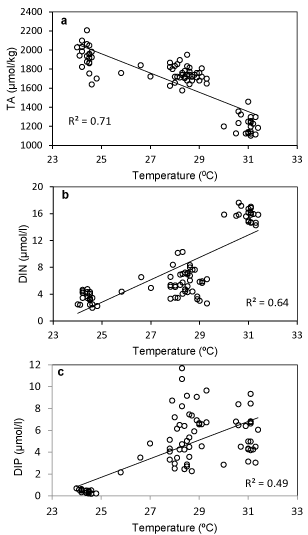
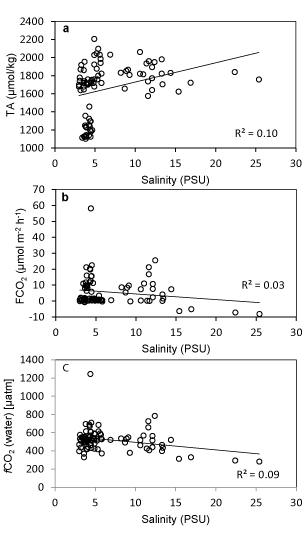
Surface water temperature of the estuary showed a significant negative correlation with the TA (R2-0.71) while the temperature was significantly and positively correlated with DIN (R2-0.64) and DIP (R2-0.49). The mentioned relationship (Figure 3) may be attributed to the high bacterial activity that was observed at high temperature leading to increased rate of CO2 release and organic matter oxidation. Consequently, the microbial metabolism at elevated temperature caused the release of nitrogen and phosphorous through degradation of organic substrates and resulted in a temperature triggered increase in DIN and DIP [42,43]. The TA of water showed a significant positive relationship with the salinity gradient of the estuary. Conversely, there was a decrease in FCO2 and fCO2 (water) in the same salinity range (Figure 4). While fCO2 (water) was significantly correlated with salinity such correlation with fCO2 was found insignificant. The increase in alkalinity vis-a-vis the decrease in fCO2 (water) may be attributed to the reduced rate of autochthonous CO2 production and resultant absorption of CO2 from the air. The system was oriented towards carbonate production increasing the rate of CO2 absorption at higher salinities.
Air-water CO2 flux
The aquatic system can act as a significant source or sink on regional to global scale [44,45]. The inorganic nutrients and organic carbon before entering the ocean are processed in the estuary. Some parts of estuaries are autotrophic while others are heterotrophic which acts as strong exporters of CO2 to the atmosphere [46,47]. The exchange of CO2 between an aquatic system and the overlying atmosphere in an area of interest is governed by two decisive factors namely the concentration gradient between the water and the air and another is the turbulent energy in the surface aqueous boundary [48]. The methodology for measuring the CO2 concentrations in both water and air in any aquatic regime has become simple and accurate [49,50]. There are various measuring procedures and equations for the determination of gas transfer velocity. Computation of gas transfer velocity using floating dome and gas tracers are problematic to handle and also overestimate the fluxes [51]. However, the predictive equations and gas tracer experiments are quite useful to suggest that at average wind speeds, tidal velocities, and estuarine depth, the gas transfer velocity appears in the range of 3-7 cm h-1 [51]. The CO2 flux calculation exhibited that the Mahanadi estuary acted as a source throughout the year. The CO2 efflux from water to air was observed maximum in the monsoon with an average value of 14.79 ± 10.78 µmol m-2 h-1 and minimum in winter (0.48 ± 0.24 µmol m-2 h-1). This is in concurrence with the expected organic carbon input into the estuary from the terrestrial catchments and their degradation in the estuary. In pre-monsoon, a lesser magnitude of flux was found (6.33±9.11 µmol m-2 h-1) as compared to monsoon. However, the flux value varied between -8.14 to 58.10 µmol m-2 h-1 throughout the year. Out of 88 observations, nine only showed negative flux values, which were attributed to post-monsoon period suggesting some areas of the estuary (towards the estuarine end) acted as a sink for cooler months. This indicated that though there was an ephemeric phase of net autotrophy, there was prolonged and dominant phase of heterotrophy in the estuary making it a source of CO2. However, the majority of positive flux value suggests that the estuary acts as a strong source during pre-monsoon and monsoon while on the contrary, it acts as a weak source in winter months. This is further supported by the autotrophic nature of the Mahanadi estuary during winter months. However, Ganguly et al. [36], have shown higher efflux (611.45 m-2 day-1 during pre-monsoon in Mahanadi estuary. Other east coast estuaries namely Hooghly estuary displayed ~25.23 µmol m-2 h-1 during pre-monsoon and ~-9.05 µmol m-2 h-1 during winter [38,52].
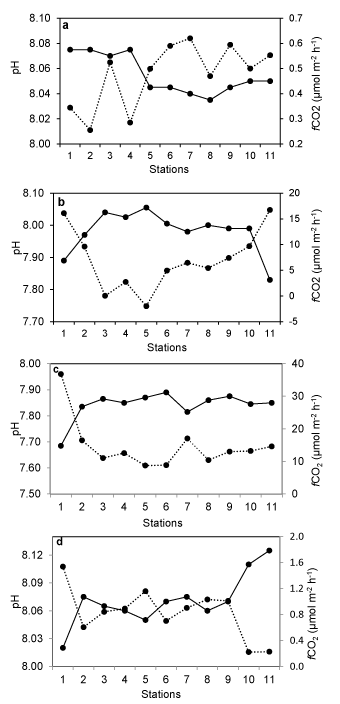
TA and fCO2 showed a significant negative correlation in the estuary during the observation period (Figure 5a). On the other hand, CO2 flux density was positively correlated with fCO2 (water) (Figure 5b). This is an indication of the fact that reduced alkalinity at higher fCO2 is the result of the carbonic acid formation. Significant station wise variation in pH and fCO2 was observed during the observation period in the estuary (Figure 6). The variation was more pronounced in some stations whereas less pronounced in other stations irrespective of the seasons. Minimum fluctuations of these parameters were observed in monsoon and post-monsoon and comparatively more fluctuations were observed in winter and summer months. Among various stations, fluctuation of a higher magnitude was observed in stations 1-3 and 10 and 11, whereas near consistency was observed among other stations. There was a significant negative relationship between fCO2 and pH in almost all stations and consistent throughout the observation period. Minimum fluctuation of fCO2 was observed during winter whereas maximum fluctuations were reported in the monsoon months. pH, however, had lower fluctuations among the stations and among the seasons.
Net ecosystem metabolism
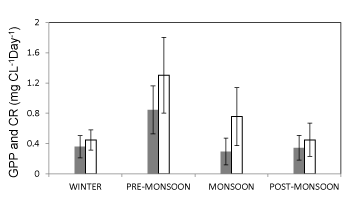
The GPP of the estuary ranged between 0.05 to 1.50 mgC L-1 day-1 during the study period. As expected, GPP was high in pre-monsoon months and low in post-monsoon months. There was no significant variation in the rate of net production between post-monsoon and winter months but the amount of TOC in post-monsoon months was significantly higher (7.29 ±1.13 mg L-1) than the other seasons of the year (3.20 ±0.72 mg L-1). This high TOC load may be attributed to the allochathonous carbon input from surrounding terrestrial ecosystem [53,54]. The CR varied linearly with the GPP indicating high gross production in the pre-monsoon months (Figure 7). From the results, it may be inferred that the increased temperature coupled with high bacterial activity caused the sufficient release of nutrients supporting higher primary production. The assumption is supported by a high CR in the pre-monsoon months [55,20].
Conclusion
The results of the present investigation revealed that the monsoonal discharge has decisive control over the inorganic carbon components in the surface water of the Mahanadi estuary. The pre-monsoon period was significantly different from other seasons in terms of net ecosystem metabolism attaining higher values of GPP and CR but such gross production was not enough to maintain autotrophy. The estuary as a whole acted as a net source of CO2 on a seasonal basis, primarily contributed by the organic carbon influx from the associated land habitats. DIC of the estuarine water depends upon the pH which is mainly regulated by evasion of CO2, the concentration alkalinity and carbonate precipitation and dissolution. The concentrations of CO2 and fluxes from the study sites are comparable to those estimated from the previous literature data in coastal oceans. The intra-annual variability of fCO2 (water) has the important role in controlling the air-water CO2 flux. It can be concluded that the source potential of the Mahanadi estuary was found to be weak in comparison with other recent studies. Temperature and salinity were the controlling factors in the biogeochemistry of carbon. The phytoplankton biomass in terms of chl a was found to be less in comparison to other tropical estuarine systems throughout the study period further strengthening the allochathonous organic carbon input into the estuary.
I would like to thank Bychikhin N.P., Orlov G.A., Dobrodeeva L.K., Klepikova R.A., Udalova L.S., Lus E.A., Kuznetsova M.N., Smolnikov L.A., Ternovskiji L.N., Batygina N.I., Rzshevskaja V.N., Pjankov S.M., Pisarenko E.F., Bubnov V.V., Popov O.A., Mozhsaev S.A., Galushev V.I. and all the anonymous reviewers for their important and useful comments.
- Zhai W, Dai M (2009) On the seasonal variation of air–sea CO2 fluxes in the outer Changjiang (Yangtze River) Estuary, East China Sea. Mar Chem 117: 2-10. Link: https://goo.gl/54t2FD
- Turk D, Malačič V, DeGrandpre MD, McGillis WR (2010) Carbon dioxide variability and air‐sea fluxes in the northern Adriatic Sea. J Geophys Res-Oceans 115:C10043. Link: https://goo.gl/MslZ9Q
- Borges AV, Delille B, Frankignoulle M (2005) Budgeting sinks and sources of CO2 in the coastal ocean: Diversity of ecosystems counts. Geophys Res Lett 32: L14601. Link: https://goo.gl/Qw1uPq
- Borges AV, Tilbrook B, Metzl N, Lenton A, Delille B (2008) Inter-annual variability of the carbon dioxide oceanic sink south of Tasmania. Biogeosci Discuss4: 3639-3671. Link: https://goo.gl/x0J0mY
- Walsh JJ (1991) Importance of continental margins in the marine biogeochemical cycling of carbon and nitrogen. Nature 350: 53-55. Link: https://goo.gl/0XAVq8
- Frankignoulle M, Abril G, Borges A, Bourge I, Canon C, et al. (1998) Carbon dioxide emission from European estuaries. Science 282: 434-436. Link: https://goo.gl/A3n6xW
- Mukhopadhyay SK, Biswas H, De TK, Sen S, Jana TK (2002) Seasonal effects on the air–water carbon dioxide exchange in the Hooghly estuary, NE coast of Bay of Bengal, India. J Environ Monit 4: 549-552. Link: https://goo.gl/5eNSHf
- Mahowald N, Jickells TD, Baker AR, Artaxo P, Benitez‐Nelson CR, et al. (2008) Global distribution of atmospheric phosphorus sources, concentrations and deposition rates, and anthropogenic impacts. Global Biogeochem Cy 22: GB4026. Link: https://goo.gl/zlrCuJ
- Riebesell U, Zondervan I, Rost B, Tortell PD, Zeebe RE, et al. (2000) Reduced calcification of marine plankton in response to increased atmospheric CO2. Nature 407: 364-367. Link: https://goo.gl/cgtLmy
- Kempe S, Pegler K (1991) Sinks and sources of CO2 in coastal seas: the North Sea. Tellus B 43: 224-235. Link: https://goo.gl/f3IE2f
- Cornell SE (2011) Atmospheric nitrogen deposition: Revisiting the question of the importance of the organic component. Environ Pollut 159: 2214-2222. Link: https://goo.gl/MH6mKl
- Huertas IE, Navarro G, Rodríguez-Gálvez S, Lubián, LM (2006) Temporal patterns of carbon dioxide in relation to hydrological conditions and primary production in the northeastern shelf of the Gulf of Cadiz (SW Spain). Deep-Sea Res Pt II 53: 1344-1362. Link: https://goo.gl/bDrAAR
- Shynu R, Rao VP, Sarma VV, Kessarkar PM, ManiMurali R (2015) Sources and fate of organic matter in suspended and bottom sediments of the Mandovi and Zuari estuaries, western India. Curr Sci 108: 226-238. Link: https://goo.gl/DnDqC5
- Takahashi T, Sutherland SC, Wanninkhof R, Sweeney C, Feely RA, et al. (2009) Climatological mean and decadal change in surface ocean pCO2, and net sea–air CO2 flux over the global oceans. Deep-Sea Res Pt II 56: 554-577. Link: https://goo.gl/93jMYL
- Cai WJ, Dai M, Wang Y (2006) Air‐sea exchange of carbon dioxide in ocean margins: A province‐based synthesis. Geophys Res Lett 33, L12603. Link: https://goo.gl/BqPTOS
- Laruelle GG, Durr HH, Slomp CP, Borges AV (2010) Evaluation of sinks and sources of CO2 in the global coastal ocean using a spatially-explicit typology of estuaries and continental shelves. Geophys Res Lett 37:L15607. Link: https://goo.gl/K3ZFhY
- Thomas H, Bozec Y, Elkalay K, De Baar HJ (2004) Enhanced open ocean storage of CO2 from shelf sea pumping. Science 304: 1005-1008. Link: https://goo.gl/paFfs2
- Chen CTA, Borges AV (2009) Reconciling opposing views on carbon cycling in the coastal ocean: continental shelves as sinks and near-shore ecosystems as sources of atmospheric CO2. Deep-Sea Res Pt II56: 578–590. Link: https://goo.gl/M21lwQ
- Vijith V, Sundar D, Shetye SR (2009) Time-dependence of salinity in monsoonal estuaries. Estuar Coast Shelf Sci 85: 601-608. Link: https://goo.gl/inQhwM
- Sarma VV, Gupta SN, Babu PV, Acharya T, Harikrishnachari N, et al. (2009) Influence of river discharge on plankton metabolic rates in the tropical monsoon driven Godavari estuary, India. Estuar Coast Shelf S 85: 515-524. Link: https://goo.gl/RsrGqh
- Sarma VVSS, Prasad VR, Kumar BS, Rajeev K, Devi BM, et al. (2010) Intra-annual variability in nutrients in the Godavari estuary, India. Cont Shelf Res 30: 2005-2014. Link: https://goo.gl/Y2zw4o
- Sarma VVSS, Krishna MS, Rao VD, Viswanadham R, Kumar NA, et al. (2011a) Sources and sinks of CO2 in the west coast of Bay of Bengal. Tellus B 64: 10961. Link: https://goo.gl/fJA66a
- Panda UC, Sundaray SK, Rath P, Nayak BB, Bhatta D (2006) Application of factor and cluster analysis for characterization of river and estuarine water systems–A case study: Mahanadi River (India). J Hydrol 331: 434-445. Link: https://goo.gl/aBycnp
- Radhakrishna I (2001) Saline fresh water interface structure in Mahanadi delta region, Orissa, India. Environ Geol 40: 369-380. Link: https://goo.gl/2e5CwP
- Sundaray SK, Panda UC, Nayak BB, Bhatta D (2006) Multivariate statistical techniques for the evaluation of spatial and temporal variations in water quality of the Mahanadi river–estuarine system (India)–a case study.Environ Geochem Health 28: 317-330. Link: https://goo.gl/w0QALP
- Grasshoff K (1983) Determination of nutrients. In: Grasshoff K, Ehrhard M, Kremling K (eds) Methods of sea water analysis, Verlag Chemie, Weinheim 125–187. Link: https://goo.gl/7i7pMl
- APHA, AWWA, WEF (1998) Standard methods for the examination of water and wastewater, Twentieth ed. American Public Health Association, Washington DC. Link: https://goo.gl/VK6cm3
- Grasshoff K, Ehrhardt M, Kremling K (1999) Methods of seawater analysis, third ed. John Wiley & Sons, New Jersey. Link: https://goo.gl/zjtS1M
- Lewis E, Wallace DWR (1998) Program developed for CO2 system calculations. ORNL/CDIAC-105. Oak Ridge: Carbon Dioxide Information Analysis Center, Oak Ridge National Laboratory, U.S. Department of Energy. Link: https://goo.gl/md5lp9
- Peng TH, Takahashi T, Broecker WS, Olafsson J (1987) Seasonal variability of carbon dioxide, nutrients and oxygen in the northern North Atlantic surface water: observation and a model. Tellus B 39: 439-458. Link: https://goo.gl/Q4Lgmu
- Benson BB, Krause D (1984) The concentration and isotopic fractionation of oxygen dissolved in freshwater and seawater in equilibrium with the atmosphere. Limnol Oceanogr 29: 620-632. Link: https://goo.gl/FjCzWf
- Weiss RF (1974) Carbon dioxide in water and seawater: the solubility of the non-ideal gas. Mar Chem 2: 203-215. Link: https://goo.gl/rDOmbk
- Jeffrey SW, Humphrey GF (1975) New spectrophotometric equations for determining chlorophylls a, b, c1 and c2 in higher plants, algae and natural phytoplankton. BiochemPhysiolPflanz 167: 191–194. Link: https://goo.gl/SaFdM2
- Wanninkhof R (1992) Relationship between wind speed and gas exchange over the ocean. J Geophys Res 97: 7373–7382. Link: https://goo.gl/b1qVgY
- Liss PS, Merlivat L (1986) Air-sea gas exchange rates: introduction and synthesis. In: Buat-Menard P (ed) The role of air-sea exchange in geochemical cycling, Reidel, Dordrecht 113–127. Link:
- Ganguly D, Dey M, Chowdhury C, Pattnaik AA, Sahu BK, et al. (2011) Coupled micrometeorological and biological processes on atmospheric CO2 concentrations at the land-ocean boundary, NE coast of India. Atmos Environ45: 3903–3910. Link: https://goo.gl/38yjAv
- Sarma VVSS, Kumar NA, Prasad VR, Venkataraman V, Appalanaidu S, et al. (2011) High CO2 emissions from the tropical Godavari estuary (India) associated with monsoon river discharges. Geophys Res Lett 38: L08601. Link: https://goo.gl/wZNyuC
- Akhand A, Chanda A, Dutta S, Manna S, Sanyal P, et al. (2013) Dual character of Sundarban estuary as a source and sink of CO2 during summer: an investigation of spatial dynamics. Environ Monit Assess 185: 6505-6515. Link: https://goo.gl/ZDU26O
- Sarma VVSS, Kumar MD, Manerikar M (2001) Emission of carbon dioxide from a tropical estuarine system, Goa, India. Geophys Res Lett 28: 1239-1242. Link: https://goo.gl/LmT9m8
- Sarma VVSS, Viswanadham R, Rao GD, Prasad VR, Kumar BS, et al. (2012) Carbon dioxide emissions from Indian monsoonal estuaries. Geophys Res Lett 39: L03602. Link: https://goo.gl/9Niryy
- Gupta GVM, Thottathil SD, Balachandran KK, Madhu NV, Madeswaran P, Nair S (2009) CO2 supersaturation and net heterotrophy in a tropical estuary (Cochin, India): influence of anthropogenic effect. Ecosystems 12: 1145-1157. Link: https://goo.gl/Yeyjma
- Mahowald N, Jickells TD, Baker AR, Artaxo P, Benitez‐Nelson CR, et al. (2008) Global distribution of atmospheric phosphorus sources, concentrations and deposition rates, and anthropogenic impacts. Global Biogeochem Cy 22: GB4026. Link: https://goo.gl/I6k8QV
- Markaki Z, Loÿe-Pilot MD, Violaki K, Benyahya L, Mihalopoulos N (2010) Variability of atmospheric deposition of dissolved nitrogen and phosphorus in the Mediterranean and a possible link to the anomalous seawater N/P ratio. Mar Chem 120: 187-194. Link: https://goo.gl/u4rHES
- Sarmiento JL, Sundquist ET (1992) Revised budget for the oceanic uptake of anthropogenic carbon dioxide. Nature 356: 589-593. Link: https://goo.gl/95xnCa
- Cole JJ, Caraco NF, Kling GW, Kratz TK (1994) Carbon dioxide supersaturation in the surface waters of lakes. Science 265: 1568-1570. Link: https://goo.gl/aWzkjU
- Kemp WM, Smith EM, Marvin-DiPasquale M, Boynton WR (1997) Organic carbon balance and net ecosystem metabolism in Chesapeake Bay. Mar Ecol Prog Ser 150: 229-248. Link: https://goo.gl/O3ZdKQ
- Raymond PA, Bauer JE, Cole JJ (2000) Atmospheric CO2 evasion, dissolved inorganic carbon production, and net heterotrophy in the York River estuary. Limnol Oceanogr 45: 1707-1717. Link: https://goo.gl/fde5Hh
- Macintyre S, Wanninkhof R, Chanton JP (1995) Trace gas exchange across the air–water interface in freshwaters and coastal marine environments. In: Mattson PA, Harris RC (eds) Biogenic trace gases: measuring emissions from soils and waters. Blackwell, New York 52–57.
- Sellers P, Hesslein RH, Kelly CA (1995) Continuous measurement of CO2 for estimation of air‐water fluxes in lakes: An in situ technique. Limnol Oceanogr 40: 575-581. Link: https://goo.gl/29HPmC
- Murphy PP, Feely RA, Wanninkhof R (1998) On obtaining high-precision measurements of oceanic pCO2 using infrared analyzers. Mar Chem 62: 103-115. Link: https://goo.gl/PVaeyC
- Raymond PA, Cole JJ (2001) Gas exchange in rivers and estuaries: choosing a gas transfer velocity. Estuaries 24: 312-317. Link: https://goo.gl/uSNGqs
- Akhand A, Chanda A, Dutta S, Manna S, Hazra S, et al. (2013) Characterizing air–sea CO2 exchange dynamics during winter in the coastal water off the Hugli-Matla estuarine system in the northern Bay of Bengal, India. J Oceanogr 69: 687-697. Link: https://goo.gl/TlGuaG
- Ram AS, Nair S, Chandramohan D (2003) Seasonal shift in net ecosystem production in a tropical estuary. Limnol Oceanogr 48: 1601-1607. Link: https://goo.gl/aFETof
- Thottathil SD, Balachandran KK, Gupta GV, Madhu NV, Nair S (2008) Influence of allochthonous input on autotrophic–heterotrophic switch-over in shallow waters of a tropical estuary (Cochin Estuary), India. Estuar Coast Shelf S78: 551-562. Link: https://goo.gl/CEcIjb
- Borges AV (2005) Do we have enough pieces of the jigsaw to integrate CO2 fluxes in the coastal ocean? Estuaries 28: 3-27 . Link: https://goo.gl/n0hCVt

Article Alerts
Subscribe to our articles alerts and stay tuned.
 This work is licensed under a Creative Commons Attribution 4.0 International License.
 Save to Mendeley
